What are trading chart patterns?
All technical analysis of exchange trade is based on the statement that history on the market repeats itself, so one can periodically observe the same kind of developments in similar trading situations. Such situations are called patterns. In other words, a pattern is a certain specific figure formed on the chart by the price or indicator which allows us to predict further price movement in the market with high probability.
Long-term market assessments have revealed recurring patterns in data that can be used to forecast price movement in the future. There are bearish and bullish stock patterns, as well as patterns that signal a trend change and patterns that indicate a trend continuance. It’s worth noting that the chance of a price shift based on chart pattern types isn’t 100%, but it’s high enough to be useful in trading.
Traditionally, there are three types of different chart patterns. The main factor by which the figure gets its place in the classification is the direction of price movement after the formation of the pattern.
-
Patterns of trend continuance. Price movement in the same direction is thought to be the most likely following the end of the trend continuation pattern.
-
Trend reversal patterns. The appearance of such patterns warns about the change of the current trend or a serious price correction. Often such patterns are formed at the historical maximums or at the strong support/resistance levels. Bearish reversal patterns, such as the double top and head-and-shoulders, indicate a potential decline in asset prices. Bullish reversal patterns, like the double bottom and inverse head-and-shoulders, signal a potential shift from a downtrend to an uptrend.
-
Undefined patterns. They can inform the trader about the trend continues as well as about the reversal. The direction of the price depends on other indicators and trends.
There are a huge number of trading charts patterns for each of these types, but this article will look at the top 10 most popular ones that every trader should know.
Why are trading patterns so important: head and shoulders pattern?
The importance of patterns can be explained by the following advantages.
-
Visibility. Thanks to chart patterns analysis a trader sees absolutely clear which figure begins to emerge and what further changes are possible.
-
Systematicity. If a trading pattern is formed, it is formed according to strict rules. If the rules are broken, it is not a pattern and the corresponding analysis methods cannot be applied to it.
-
Independence. Graphical formations of technical analysis allow analyzing the market without using additional instruments. Everything a trader needs to make a decision is presented on the screen of the monitor.
-
Interpreting chart patterns is crucial for traders to avoid common mistakes and enhance decision-making.
The most popular graph patterns names: most common chart patterns
Understanding the most common chart patterns is essential for making informed trading decisions.
1. Head and Shoulders
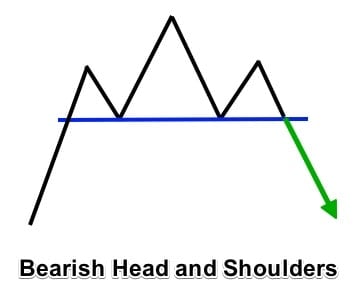
This pattern is formed in an uptrend on the price maximums. It has three upper points - the conventional head in the middle and shoulders on the sides plus two points of low - the conventional neckline should be drawn through them. When the pattern is well-formed, the price falls below the neckline after the right shoulder is completed. The price is highly likely to fall by an amount equal to at least the number of points from the neck to the top of the “head”. Selling is carried out immediately after the breakdown of the chart below the neck level. The shoulders chart pattern includes both the head and shoulders and inverted head and shoulders formations.
2. Inverse head and shoulders
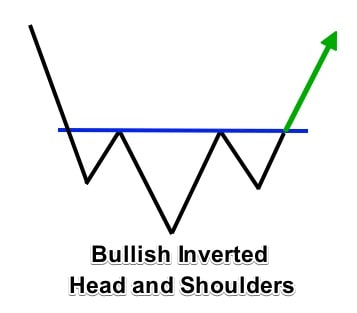
Opposite to the previous one and formed at the price minimums, when the trend is descending. Correspondingly, “head” and “shoulders” peaks are situated below the neck level, but not above, like for the standard figure. After the neckline is broken, the price is forecasted to grow by the number of points at least equal to the distance from the neckline to the “head” top. At the moment of penetration of the neckline purchase of the asset is carried out.
3. Double top
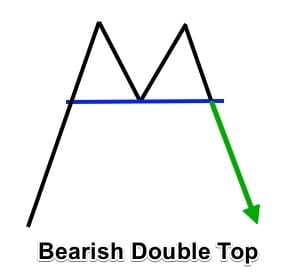
It is a local trading pattern, which is possible in the case of ascending trend at the price peak. The figure is formed by two equal or approximately equal price peaks with one peak of local minimum between them. After the end of the figure, the downtrend is forecasted, at this moment the sale is carried out.
4. Double bottom
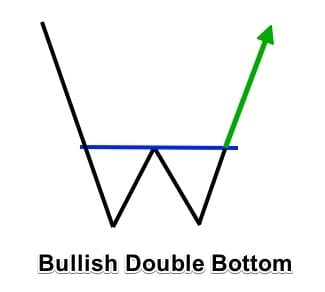
As in the case with the “Head and shoulders,” the “Double top” has a mirrored variant, which is formed on the downtrend in the area of the local minimum. The bottom two points of the mirror top are marked on the price lows, between them - the point of the local maximum. When the formation is complete and the baseline passing through the point of the local maximum is broken, the asset is bought in order to sell it at a higher price, because an uptrend is forecasted after the “Double Bottom”.
“Rounded bottom” and “Rounded top” may also be included. The rounding bottom chart pattern resembles the letter “U,” which is why it is also known as a “saucer.” It develops as a result of a sustained downward price movement. It consolidates in a specific range before beginning to rise and finally breaking over the resistance line.
“Rounded top,” in turn, looks more like an inverted “U”. The emergence of this pattern indicates the reversal of the uptrend and the probable beginning of the downtrend.
5. Triple top and Triple bottom
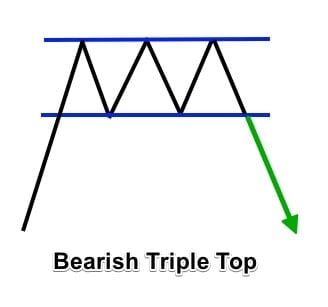
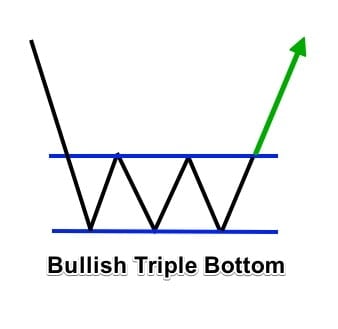
“Triple top” is drawn at the maximums when quotations tend to go upwards - unlike “Double top” it has three price peaks. It means that the chart locally goes upwards thrice and falls downwards thrice. After the third fall, the baseline is broken through and sale is carried out. The “triple bottom” mirrors the top, but not at the local maximums, but at the local minimums. Accordingly, after the baseline is broken through, a buy is carried out.
6. Wedge
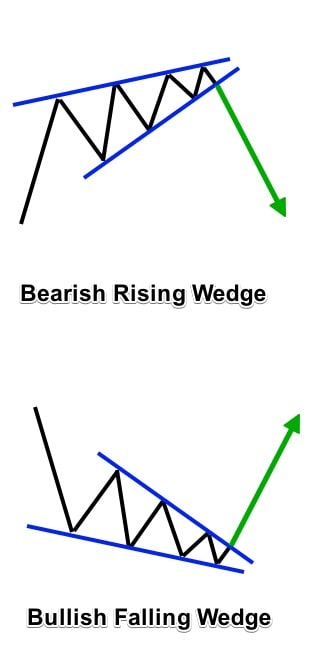
Can be formed both on the highs and lows of the price. This trading pattern “squeezes” the chart between two lines - the support line and the resistance line. Within the lines the price may go up and down several times, the breakthrough is considered to be the chart exit below the supporting line or above the resistance line. In the first case, it is selling, in the second - buying. The wedge is graphically similar to the triangle, but not identical. It belongs to the reversal patterns, the indicators define this figure quite well (like most of the classic figures).
7. Triangle
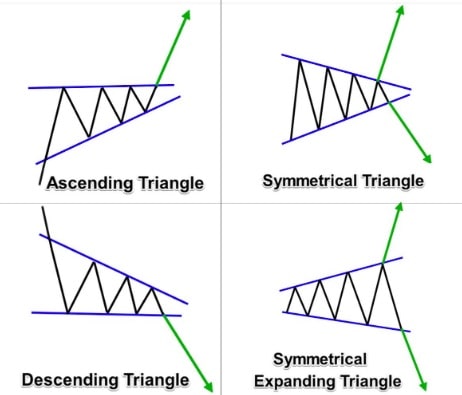
It can be equilateral, ascending or descending. All three types either continue the trend or reverse it. Unlike the “Wedge”, the support line and the resistance line completely intersect on the right side of the figure. Further, buying/selling is done depending on the type of formation and the trend:
-
In an equilateral triangle, if the chart breaks above the resistance line - buy, if below the support line - sell.
-
With an ascending triangle, buying is carried out when the chart is broken above the resistance line.
-
If the chart breaks below the support line in case of a descending triangle, sell.
8. Rhombus
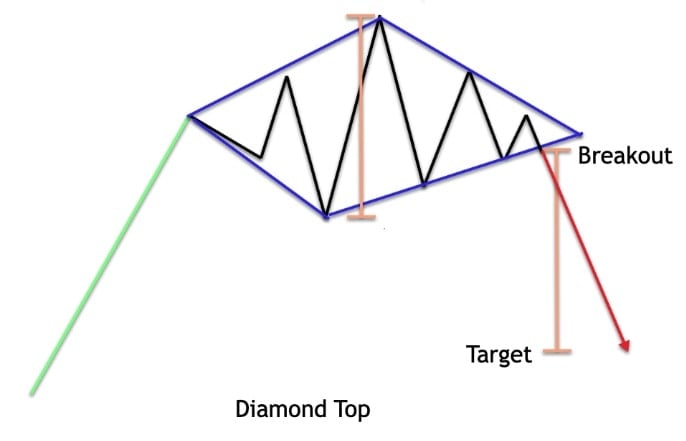
An alternative name for this trading pattern is “Diamond”. It is a rather rare market reversal pattern that can be formed during any trend on local lows/highs. If the Rhombus appeared at the highs of the price chart, it indicates that the upward movement has ended and now you can sell. If the pattern has formed at the bottom of the chart, after a downtrend, then you can wait for a reversal upwards and prepare for purchases.
9. Rectangle
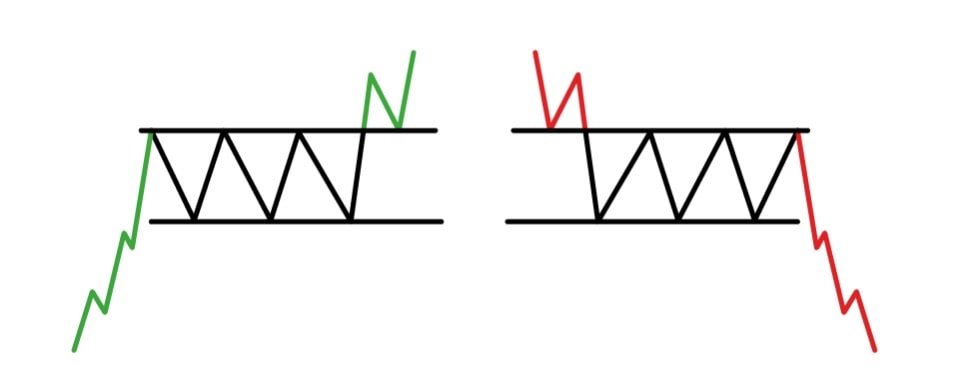
It is formed by the parallel lines of support and resistance, which form a conditional corridor for the price movement on the chart. Inside the corridor, the price consolidates and randomly changes direction. A rectangle chart pattern is formed when an asset's price consolidates between defined support and resistance levels. It is logical to trade in the direction of penetration of the formation - if it closes above the line of resistance, it is bought. Sale is carried out when the shape is closed under the support line.
10. The flag
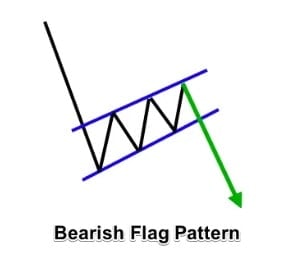
Pattern “Flag” predicts the continuation of the current market trend. It consists of two parts: a “flagpole” and a flag (the channel in which the price moves). The flag corridor can go strictly perpendicular to the “flagpole” or with a slight slope, its general shape can correspond to different figures - triangle, rectangle, or wedge. The correction ends with the exit of the prices behind the resistance lines. At this point, buying is carried out. A bullish flag pattern indicates a potential continuation of an uptrend after a price pullback. A bearish flag is a continuation pattern characterized by a price drop followed by a consolidation phase, signaling a potential further decline.
Triangle Chart Patterns
Triangle chart patterns are a type of continuation pattern that can be found in various markets, including cryptocurrencies. These patterns are formed when the price of an asset creates a series of higher highs and higher lows, known as an ascending triangle, or lower highs and lower lows, known as a descending triangle. Triangle chart patterns are valuable tools for identifying potential trading opportunities and predicting future price movements.
There are three main types of triangle chart patterns: ascending, descending, and symmetrical. Ascending triangles are typically seen as bullish continuation patterns, indicating that the prevailing trend is likely to continue upward. On the other hand, descending triangles are considered bearish continuation patterns, suggesting that the prevailing trend will likely continue downward. Symmetrical triangles, which form when the price converges into a tighter range, can signal either a bullish or bearish trend and are often used to identify potential reversals in the market.
Triangle chart patterns can take several months or even years to fully develop. Therefore, it is crucial to use them in conjunction with other technical indicators to confirm trading signals. Practicing the identification of triangle chart patterns on historical data can help traders master the art of interpreting these patterns and improve their trading strategies.
How to trade on trading patterns: interpreting chart patterns?
Detecting patterns takes practice, and you should remember that you can lose if you trust only them. However, despite the fact that the patterns give a correct prediction in about half of cases, it is advisable to pay attention to them. Trading chart patterns are essential tools for analyzing and finding opportunities in trading. Trend lines are crucial for understanding market movements and complementing chart patterns. It is not without reason that most copy trading software also includes tracking trading patterns. Various crypto trading tools also include observation of patterns. Because a chart with a pattern always gives a better idea of the anticipated price movement than a chart without a pattern.
That is, you should not trade purely on patterns. But they can be used for a more precise estimation of the market situation and to make correct decisions on the basis of technical chart patterns.
Trading with Chart Patterns
Trading with chart patterns involves leveraging technical analysis to spot potential trading opportunities and forecast future price movements. Chart patterns, when combined with other technical indicators, can provide robust trading signals that enhance decision-making.
To effectively trade with chart patterns, it is essential to practice identifying these patterns on historical data. Understanding the underlying market psychology that drives the formation of chart patterns is equally important. This knowledge helps traders anticipate market behavior and make informed decisions.
Risk management is a critical component of trading with chart patterns. Techniques such as stop-loss orders and position sizing are vital to minimize potential losses and protect capital. By incorporating these risk management strategies, traders can safeguard their investments while pursuing profitable opportunities.
Chart patterns can also be instrumental in identifying potential market reversals. By combining chart patterns with other technical indicators and risk management techniques, traders can develop a comprehensive trading strategy. This approach not only enhances the accuracy of trading signals but also helps traders achieve their trading goals.
In conclusion, chart patterns are powerful tools that can help traders identify potential trading opportunities and predict future price movements. By understanding the different types of chart patterns and learning how to trade with them, traders can develop a well-rounded trading strategy that aligns with their objectives and risk tolerance.


