How does this bot work?
The AI bot watches the market to find good trading opportunities by looking at different data and trends. It looks for assets that have been going down for a while and starts trading when this drop slows down, suggesting a possible turnaround. When it finds suitable assets, the AI bot sets up a grid bot to trade. This grid bot places many buy and sell orders at different prices to take advantage of market changes. Impressively, the AI bot can run up to 10 grid bots at the same time, allowing it to handle multiple trading strategies and opportunities, increasing the chances for profitable trades.
The AI Grid Bot uses advanced algorithms to carefully analyze and find the best grid step percentage for each trading pair, considering the changing market conditions. Each strategy has a Trailing profit feature to capture extra profits during sudden price jumps, maximizing gains and improving overall trading performance.
When is the best time to launch the bot?
As the bot is operating only in the long direction, it is better to wait for the market to be in a downward trend for some time. When you will see the exhaustion of the bear move you can start the bot. To determine this exhaustion you can use simple technical indicators on a high time-frame.
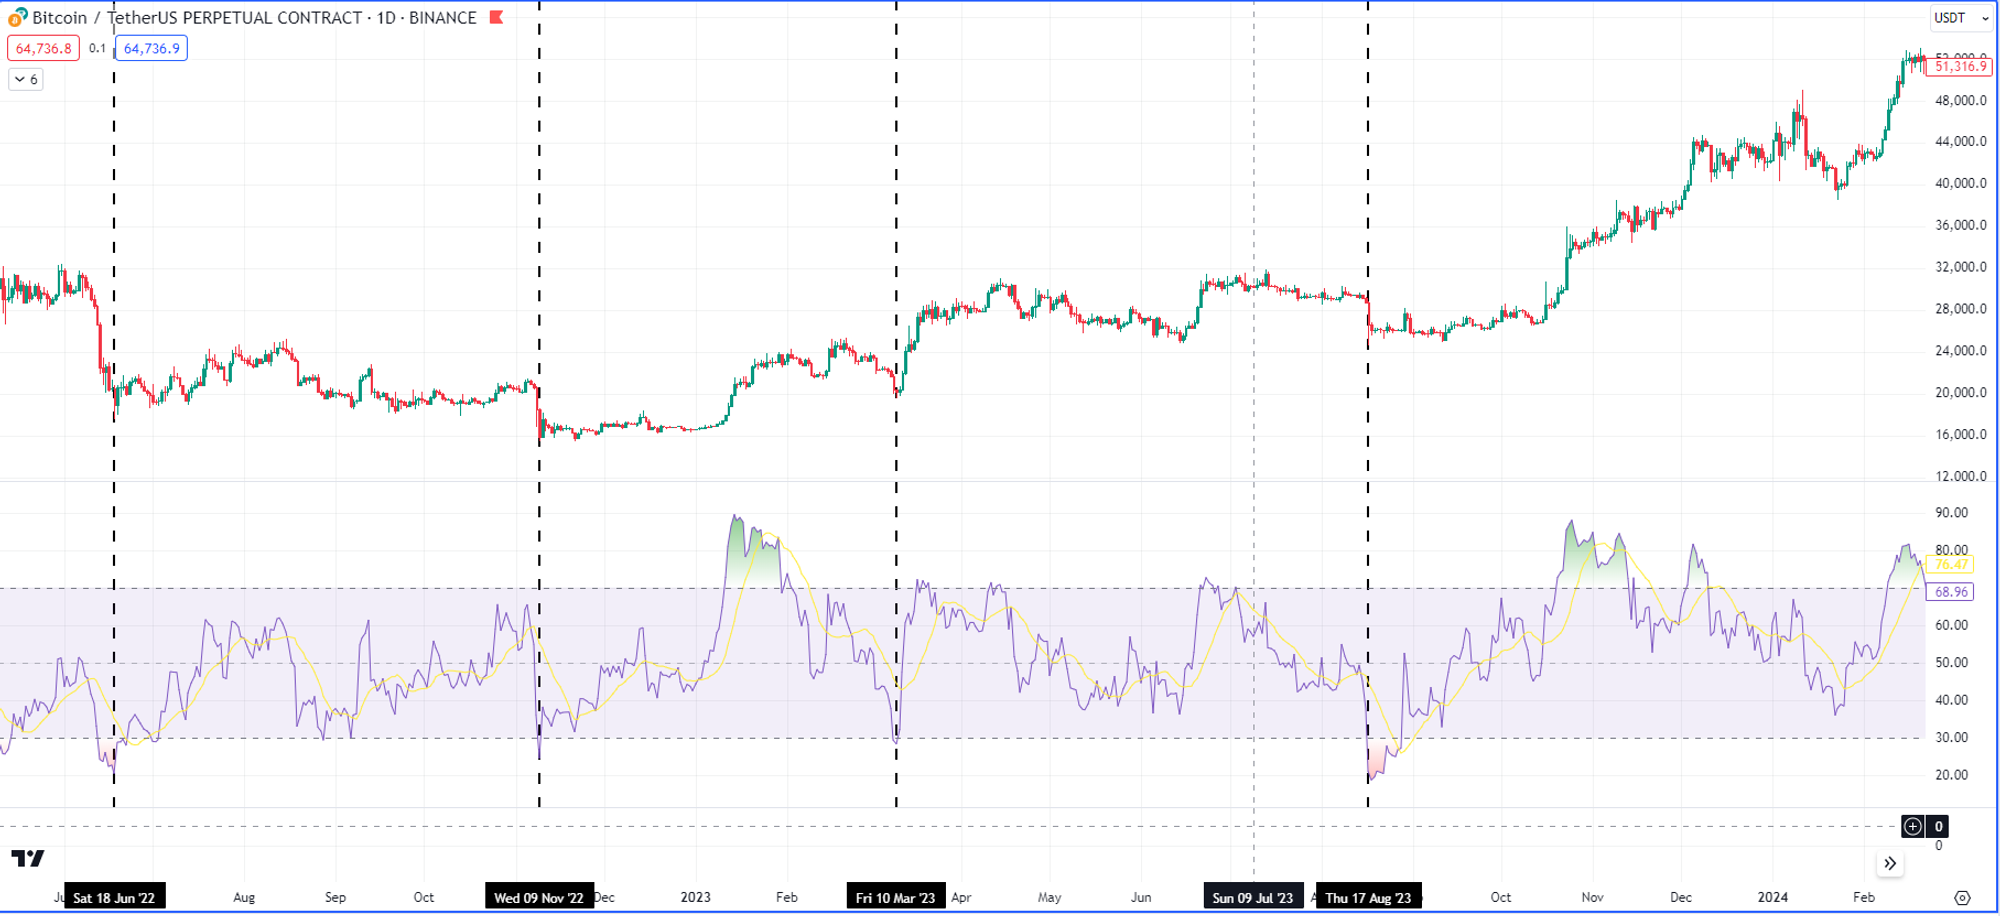
For example, you can take a daily time-frame on Bitcoin and apply the RSI (Relative Strength Index) indicator to it. The black vertical line in the chart indicates the optimal entry point based on the RSI(14) going below the 30 line, which signifies an oversold condition. In all of these cases, after the initial drop, the market tends to stay in a long-term horizontal range. During this period, the AI grid bot will continuously take small, incremental profits by exploiting the price fluctuations within this range. This strategy can be seen as more advantageous compared to the traditional Buy and Hold strategy, as it aims to capitalize on smaller market movements rather than waiting for significant price appreciation.
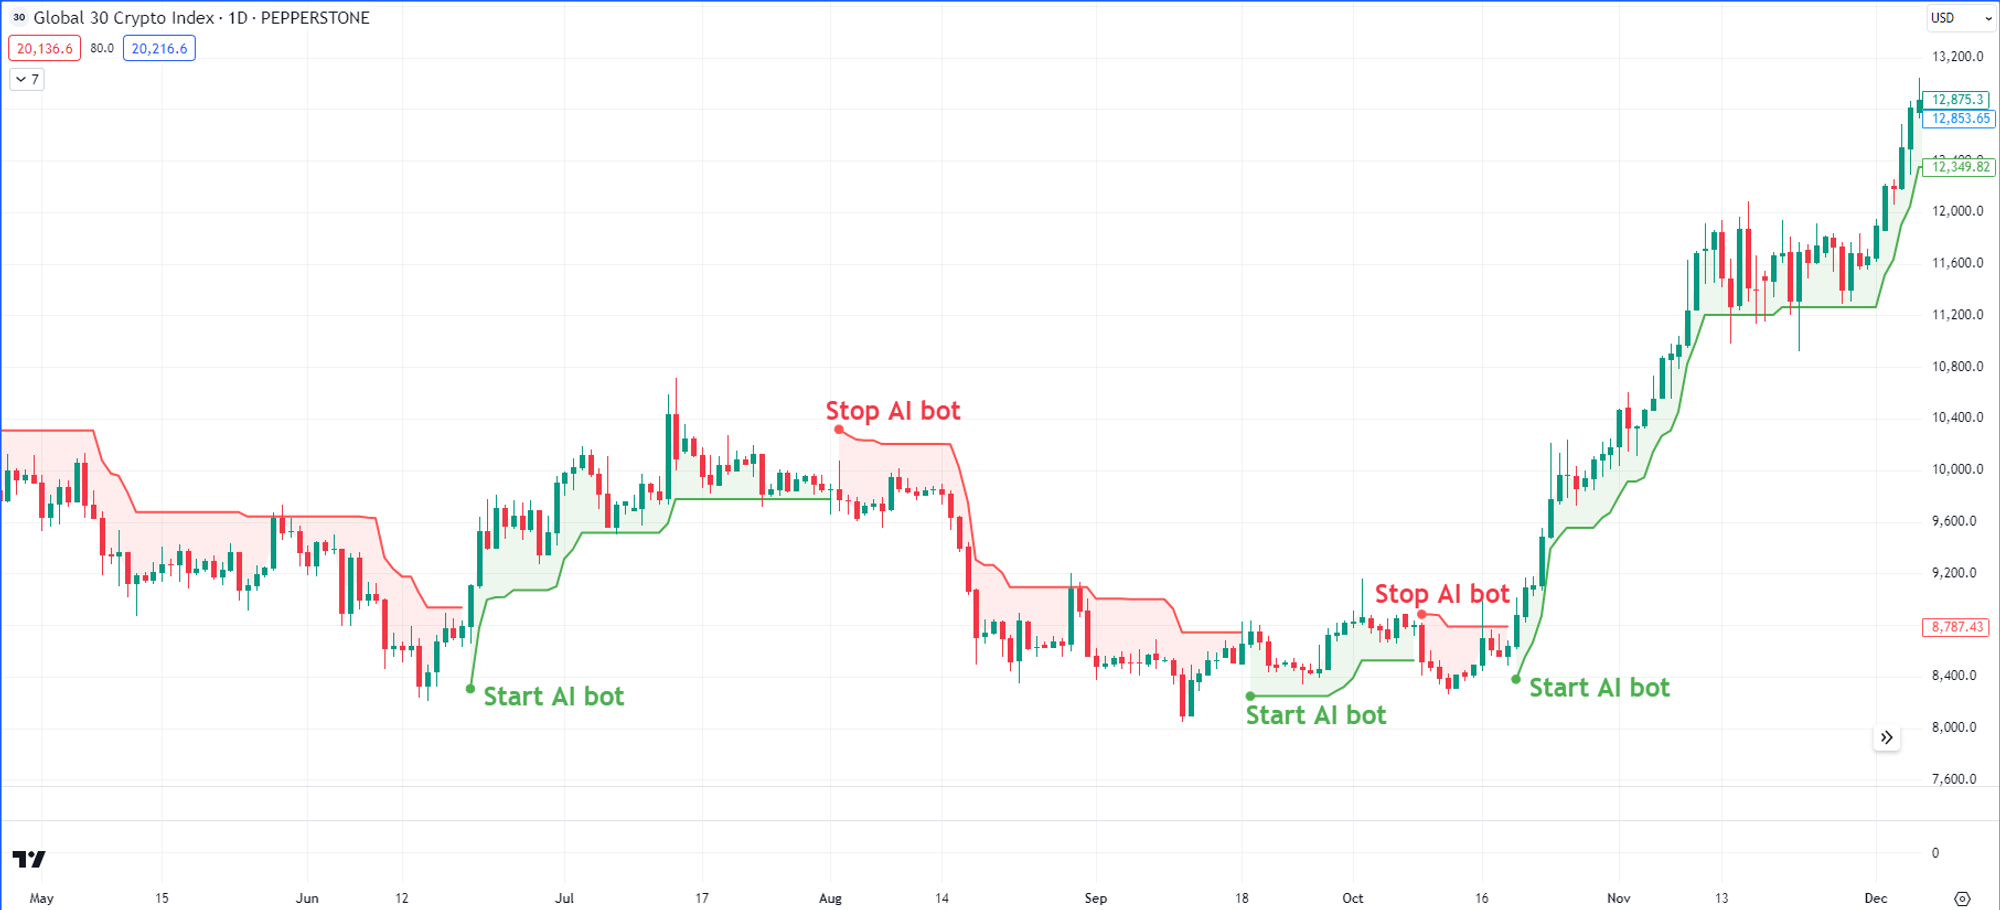
You can also use alternative indicators to determine the exhaustion of the bearish trends, such as the Super Trend technical indicator. This specific type of indicator is highly effective in identifying the end of bearish trends. However, it requires you to actively monitor and take actions regarding when to start and stop the AI bot. By doing so, you can optimize your trading strategy and potentially increase your profitability.
For Example: Here is an illustration of the SuperTrend indicator applied to the Global 30 Crypto Index. In this example, the Average True Range (ATR) index is set to 100, and the ATR Multiplier is set to 1.7. This configuration helps to smooth out price fluctuations and provides clearer signals for trend reversals. By carefully analyzing these indicators, you can make more informed decisions and enhance your trading performance.
When to stop the bot?
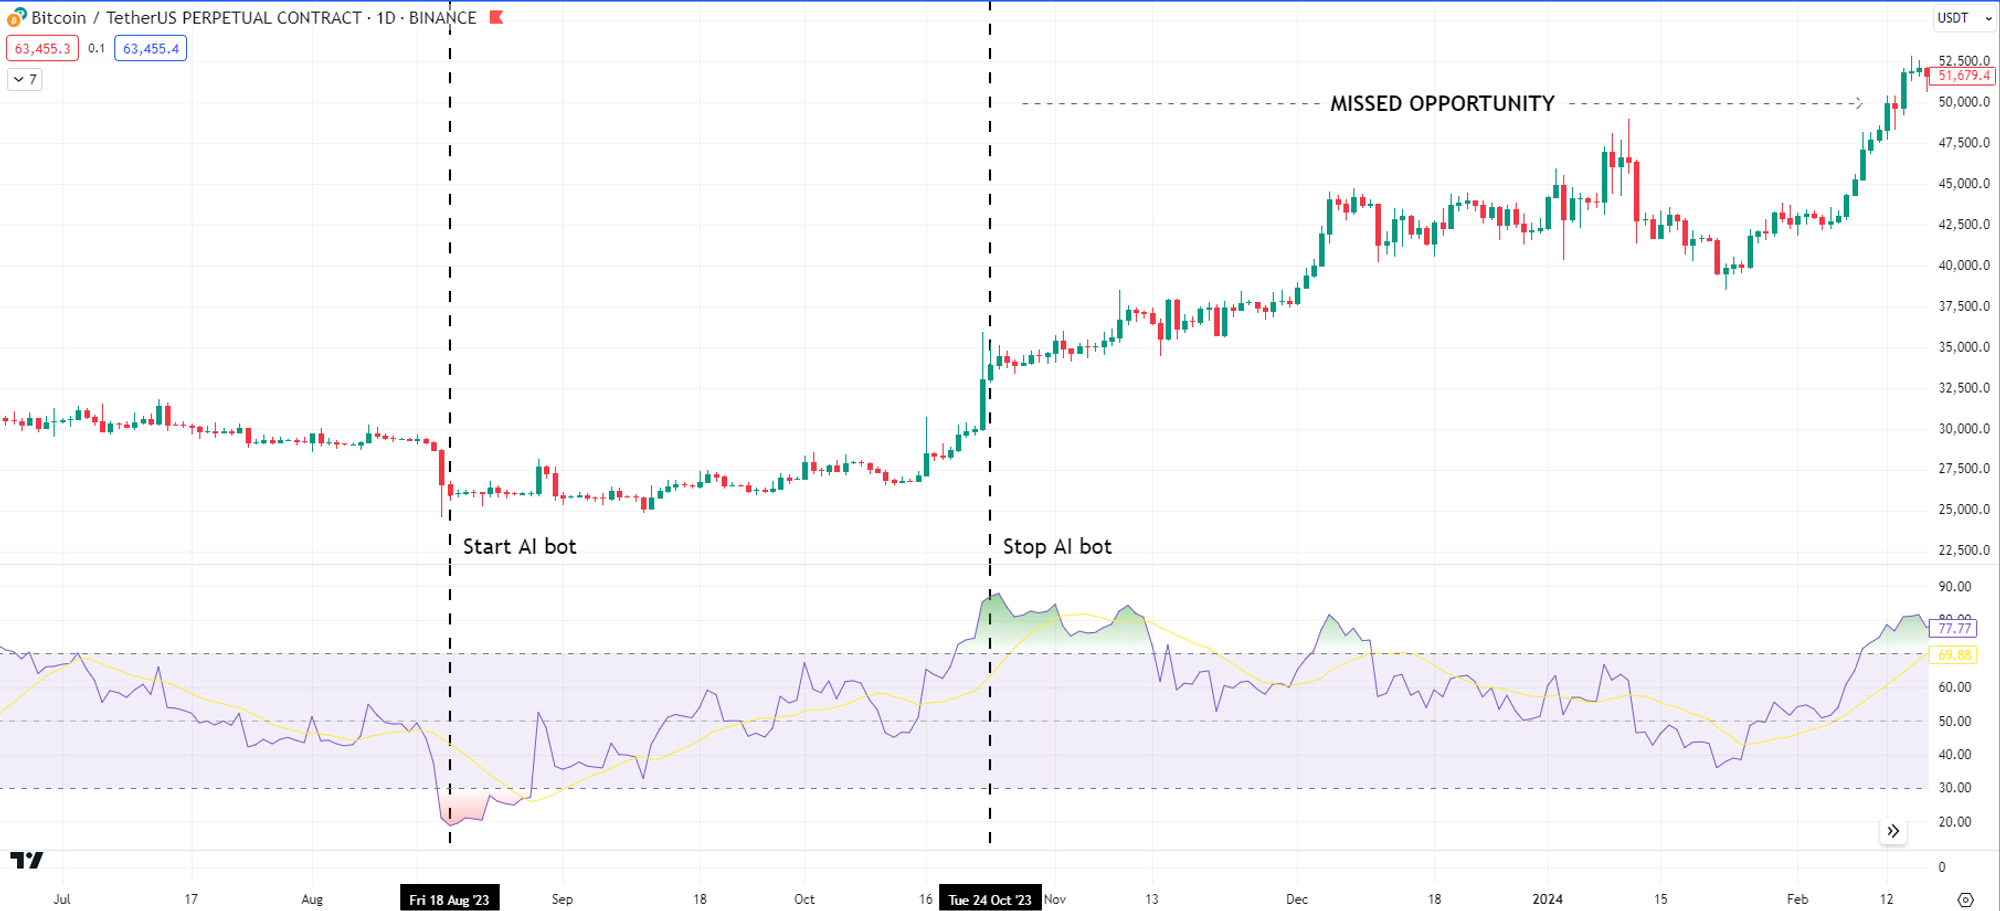
First, you can utilize signals from the opposite side to make informed decisions. For instance, if you are using the Relative Strength Index (RSI) as a criterion for entry, you can halt the AI grid bot when the RSI reaches the opposite side of the scale, specifically when the RSI goes above 70. This method, however, comes with a downside. In a bullish market, the RSI might enter the overbought territory during the initial upward wave and then begin to decline, even as the price continues to rise. As a result, you might end up missing a significant opportunity for profit because the RSI's decline could mislead you into thinking that the upward trend is over, while in reality, the price is still climbing.
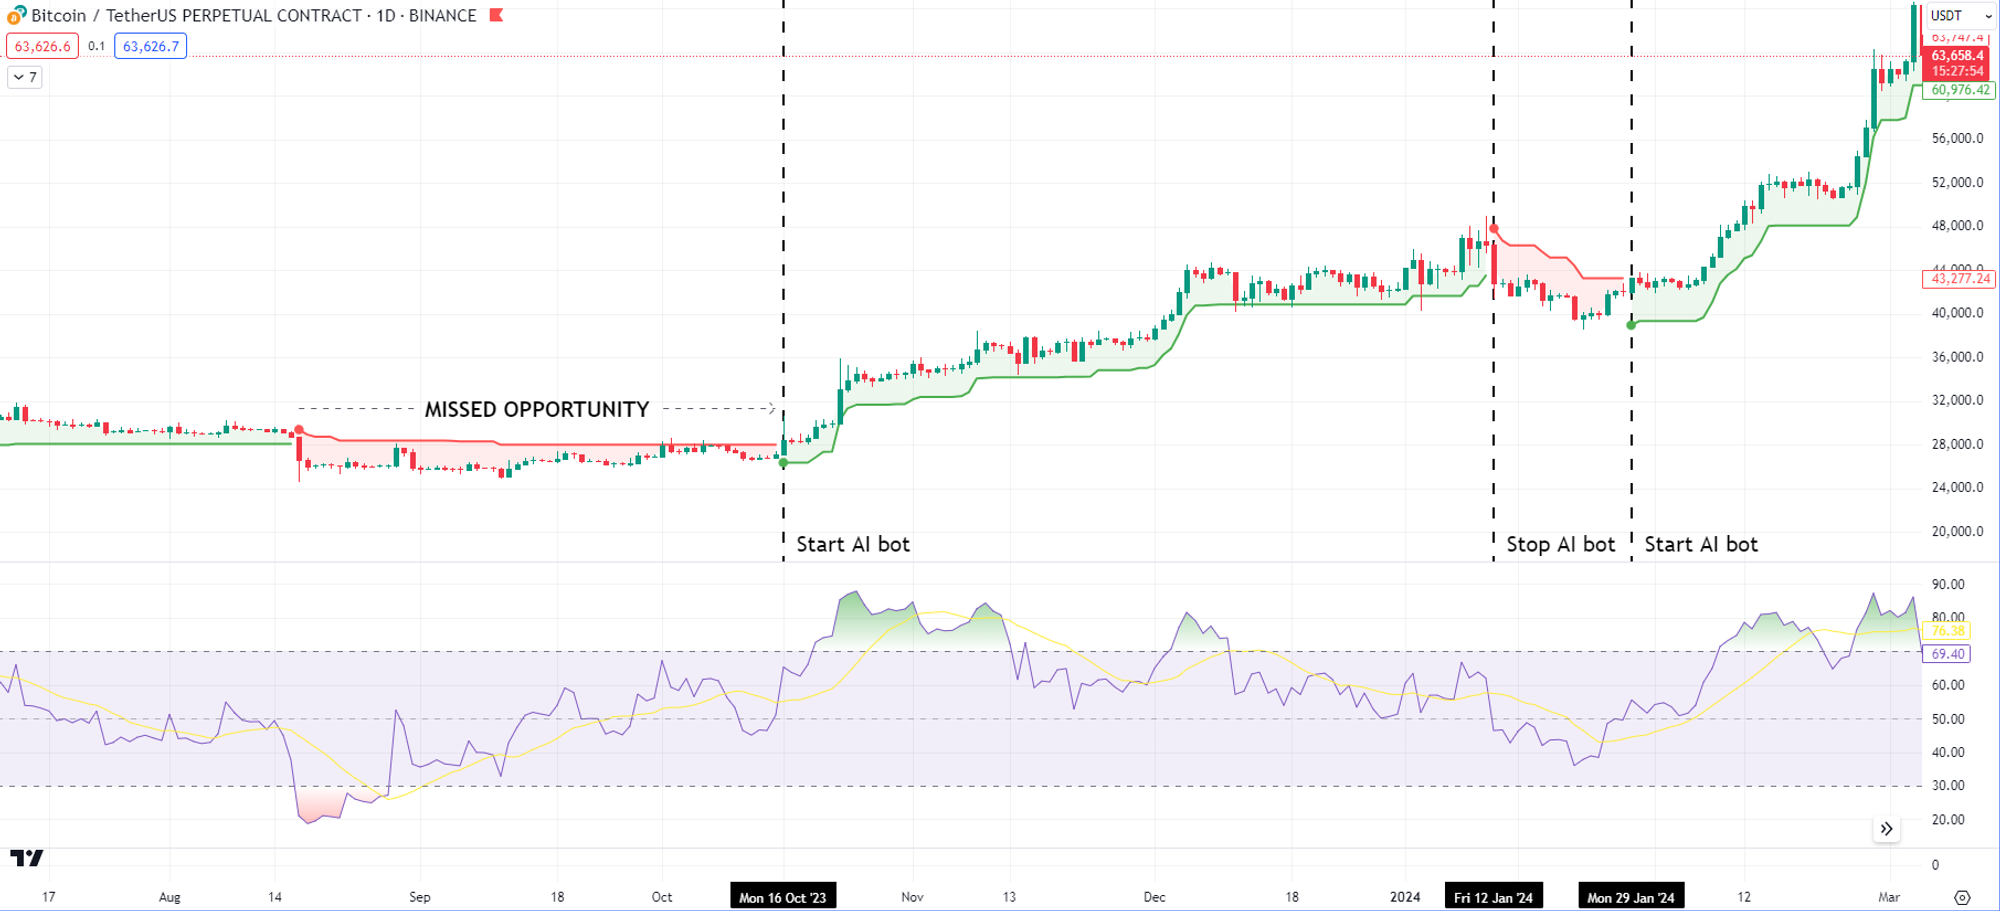
If you decide to utilize the SuperTrend indicator in your trading strategy, then this method will not only result in a more accurate exit point, allowing you to maximize your profits, but it will also enable you to re-enter the market during the bull run. By doing so, you can take advantage of ongoing upward trends and potentially increase your overall gains. This approach ensures that you are better positioned to respond to market movements and make more informed trading decisions.
How the equity curve will look like?
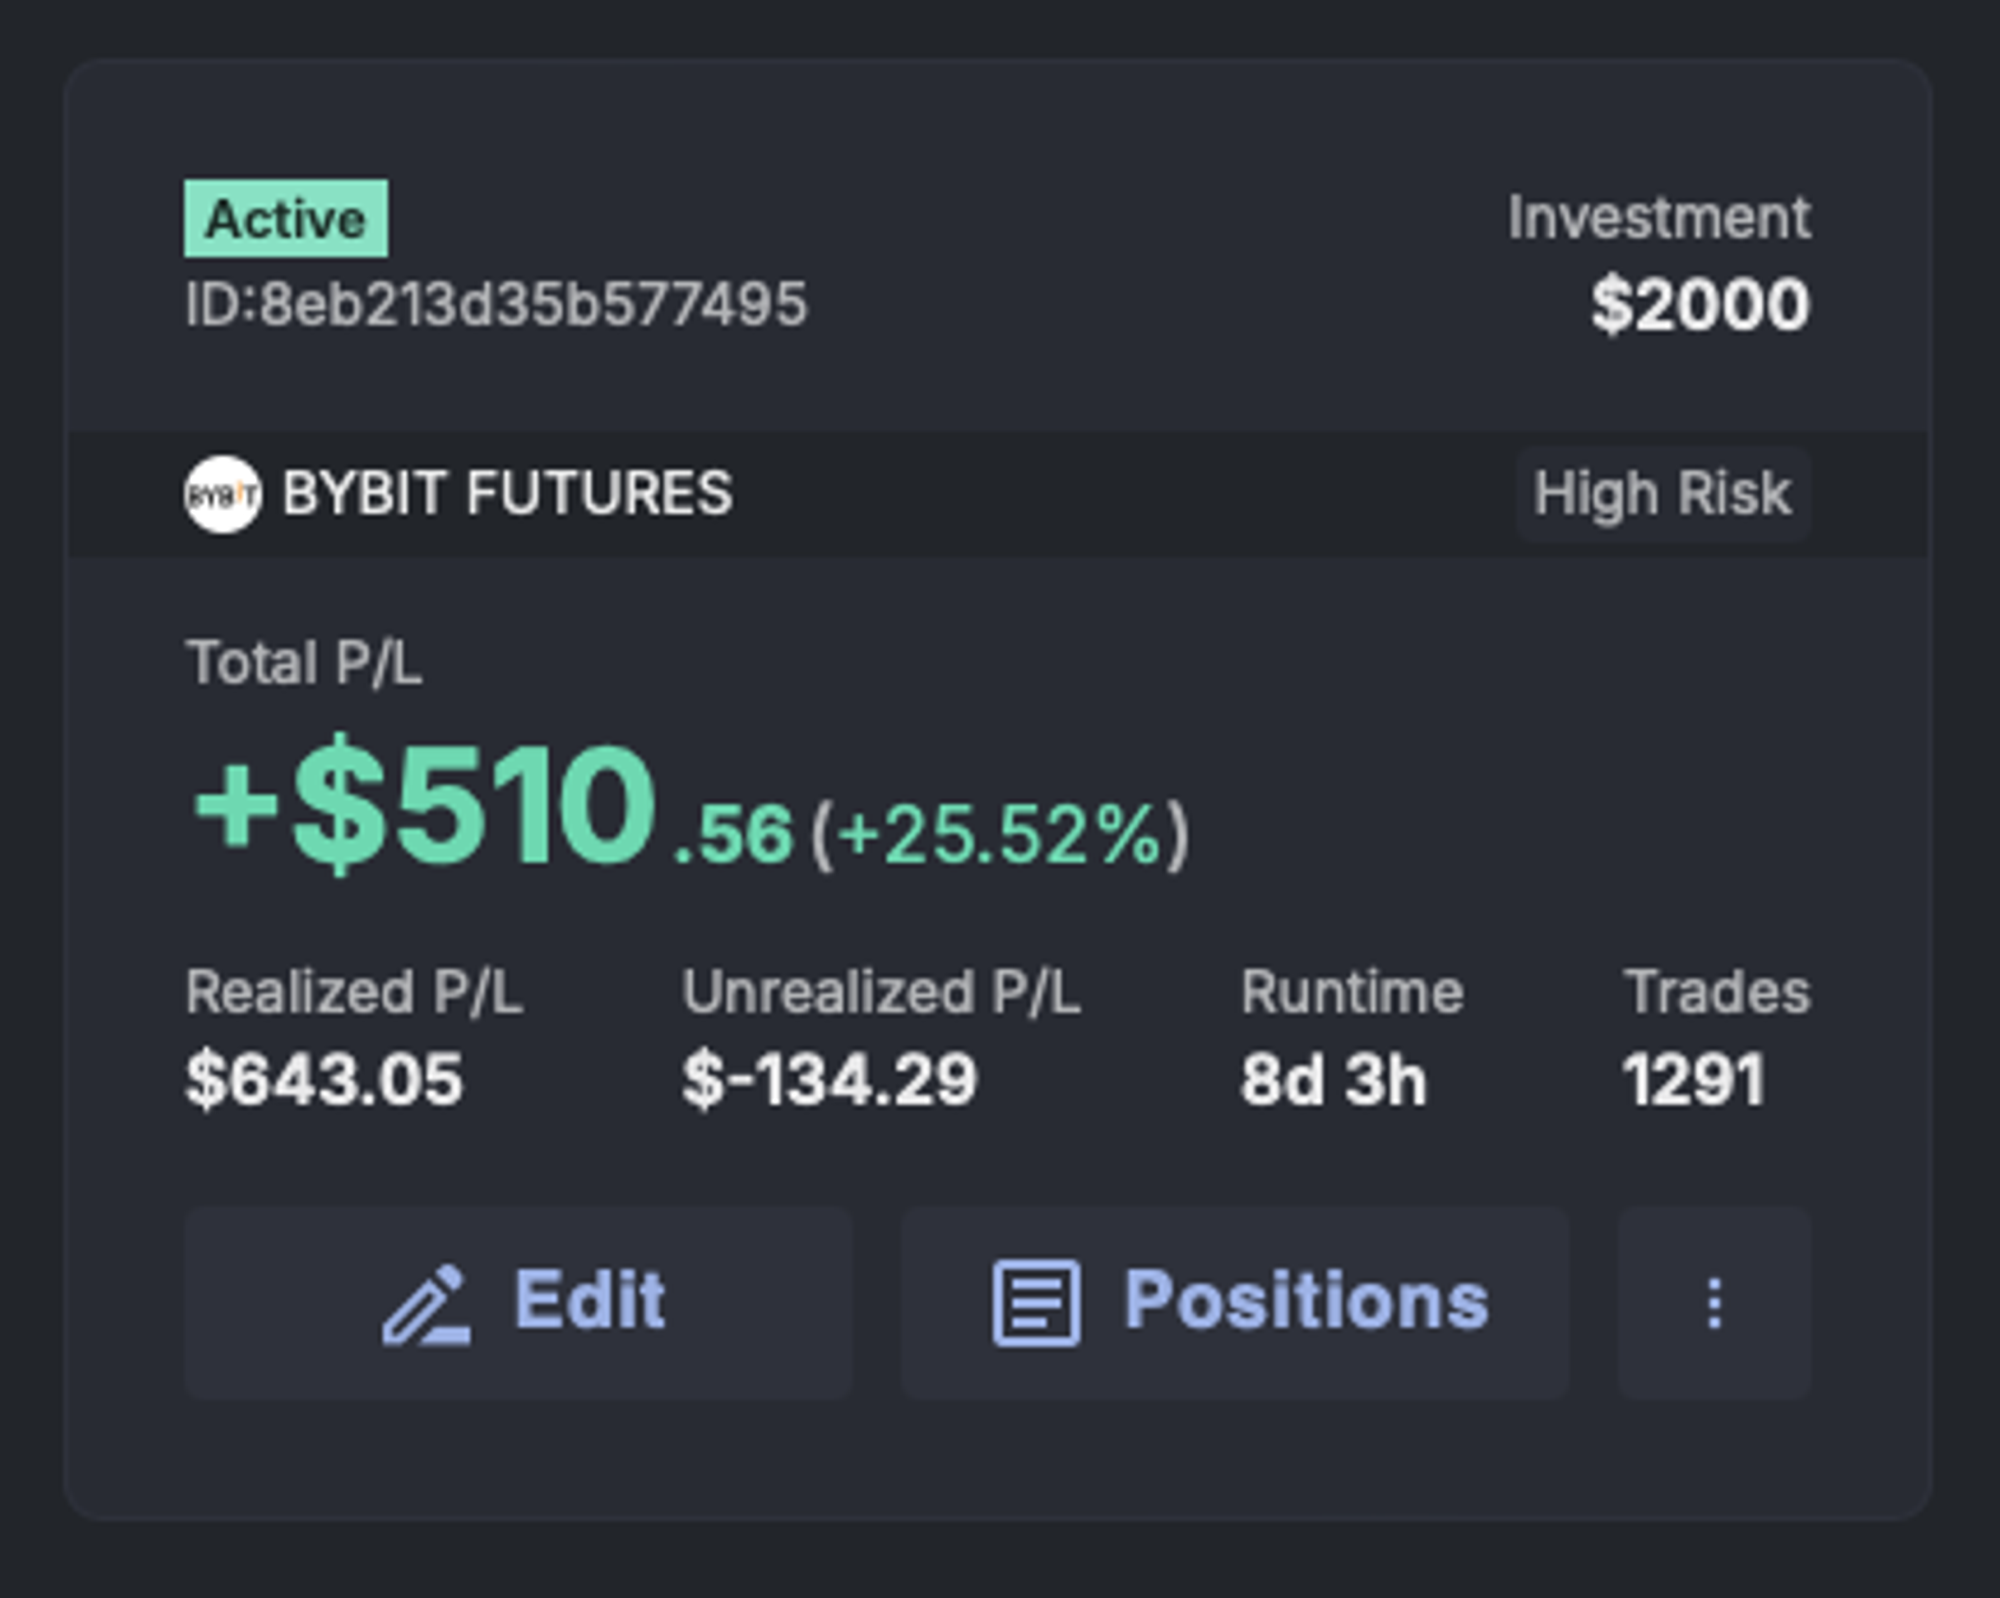
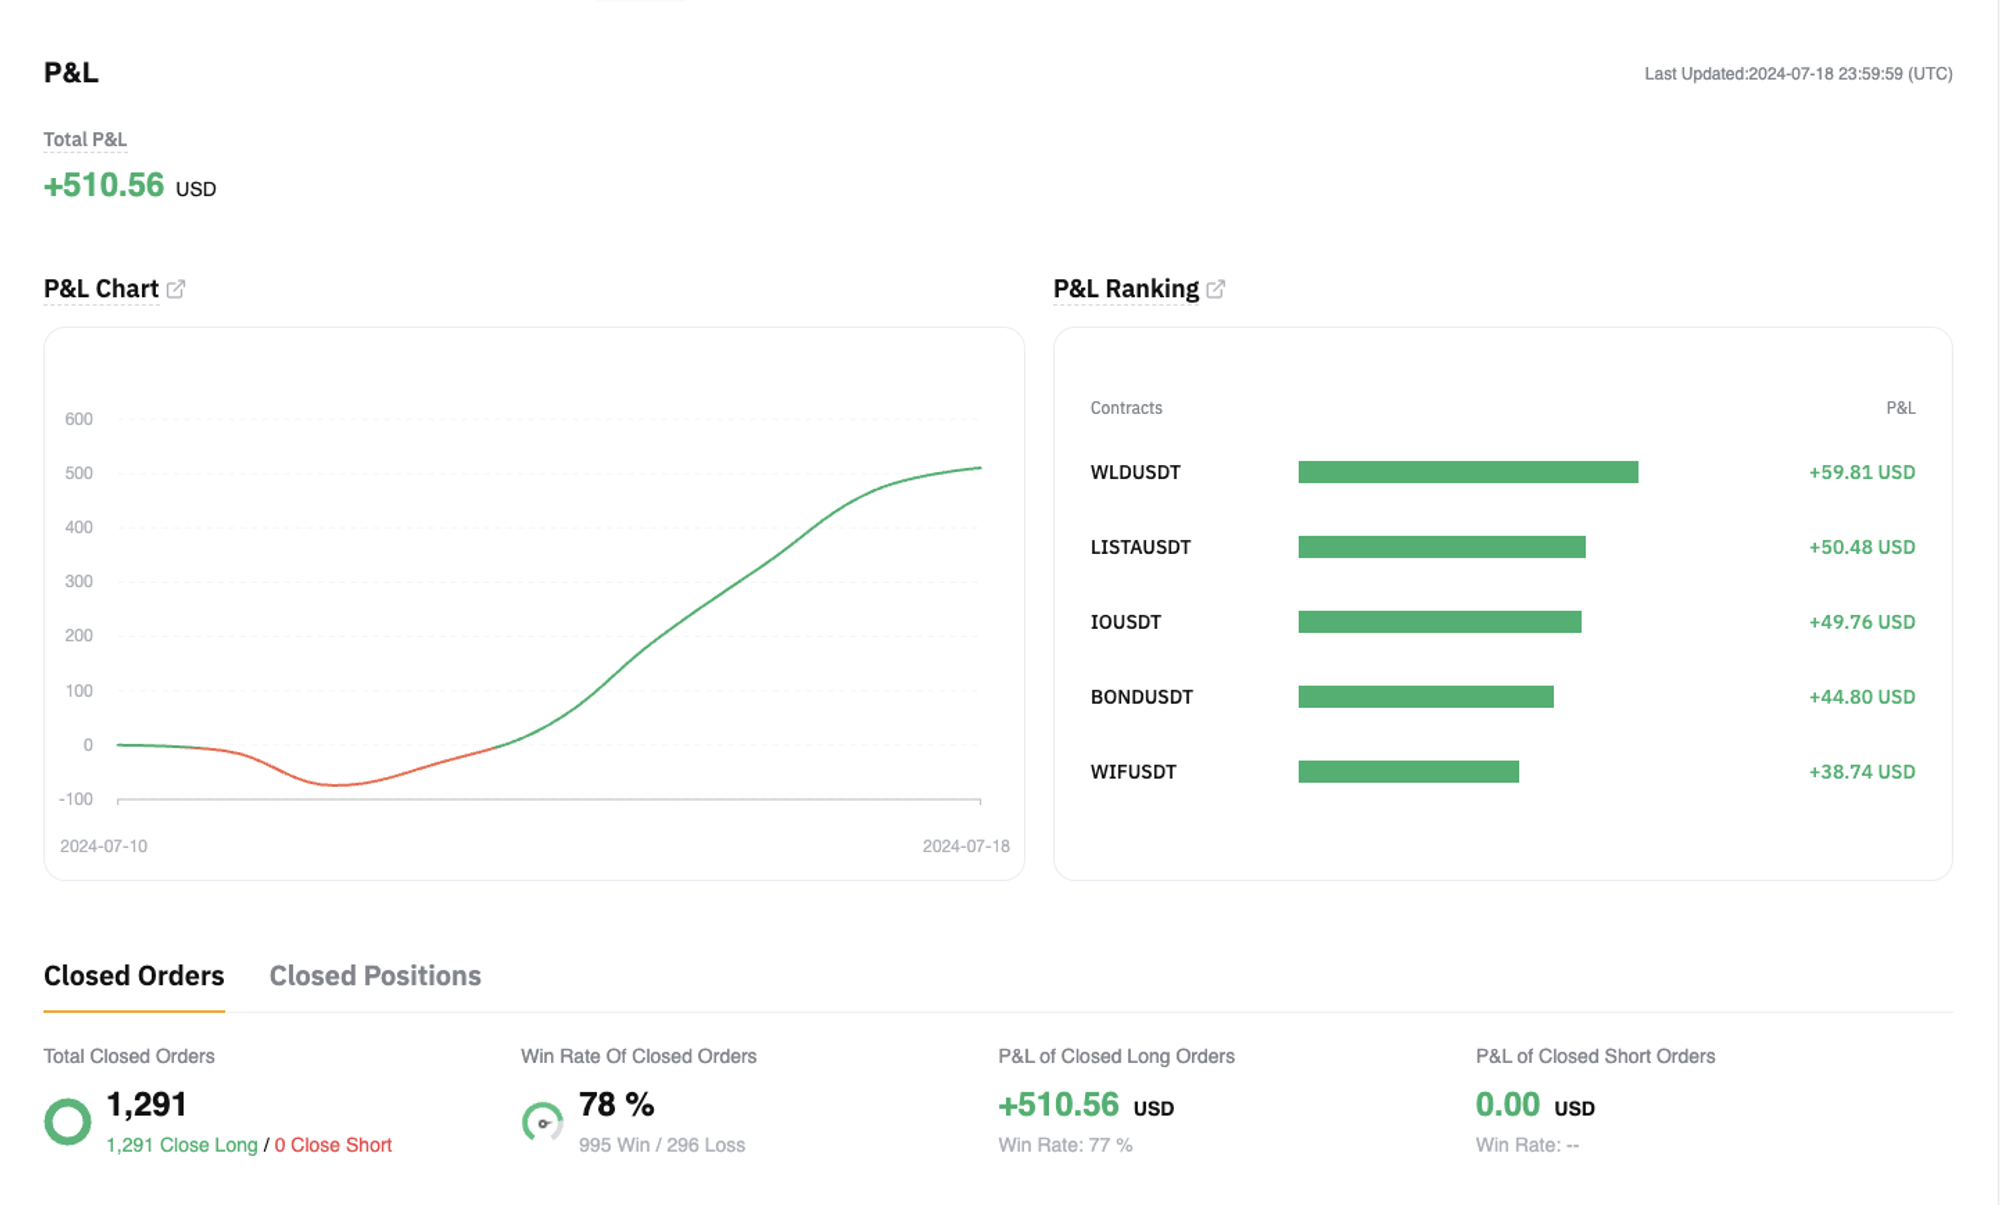
This is an example from the platform’s AI bot, which has been categorized as high risk. The bot traded over a period of 8 days, with its entry point determined by the Relative Strength Index (RSI) and its exit point based on the SuperTrend indicator. After the initial entry, the market experienced a downturn, resulting in an unrealised loss. However, following this decline, the market began to recover and move in an upward direction. As the market continued to rise, the bot was able to begin collecting profits, demonstrating its ability to adapt to changing market conditions. The second screenshot is showing the P&L curve from the Bybit Exchange.
Eight days trading results with AI GRID Bot from WunderTrading:
What are the risks?
AI Grid bot trades exclusively in the long direction. This GRID trading strategy allows the bot to be profitable in both horizontal markets, where prices move sideways with minimal fluctuations, and in bull markets, where prices are steadily increasing. The only type of market in which this AI Grid bot will struggle to perform well is a falling or bear market, where prices consistently decline.
Let’s delve into the risks associated with leaving the bot operational during a downward market movement.
During the downward movement, the bot will begin to accumulate unrealized losses as the value of its purchased assets declines. The rate at which these losses accumulate will largely depend on the market's volatility, which refers to the frequency and magnitude of price changes, and on the risk level that you have set for the AI bot. Higher risk settings may lead to faster accumulation of losses, whereas more conservative settings might mitigate some of the impact but could also limit potential profits in other market conditions.
- Low Risk: Each trade uses about 5% of your investment
- Balanced Risk: Each trade uses about 10% of your investment
- High Risk: Each trade uses about 20% of your investment
Important! Not stopping the bot during the bear market can lead to complete account liquidation
Top Tips
- Create Multiple bots on a low-risk and different entry time. This will help you to diversify your portfolio.
- Make sure you have clear entry and exit points based on any trend indicator.
- Refrain from using high-risk to deal with larger drawdowns.


