


And that's the quiet problem at the heart of this article: most beginners spend months — sometimes years — collecting indicators. Very few beginners take the one small step that separates "watching the market" from "testing whether your idea actually works."
That step is moving from a TradingView Indicator to a TradingView Strategy.
It sounds technical. It isn't. By the end of this article, you'll understand exactly what an indicator is, what a strategy is, how they're different, why the difference matters, and why — if your long-term goal is serious trading or automation — the Strategy Script is almost always the more important tool.
And we'll also talk about what comes after a strategy: a real, live trading bot.
First, let's agree on what TradingView actually is
Let's zero the whole thing out. Imagine you've never opened TradingView in your life.
A super-simplified definition
TradingView is a website (and app) where you can look at price charts for almost anything that trades: Bitcoin, Ethereum, stocks, gold, the euro, you name it. You can draw on the charts, follow other traders, and — this is the part we care about — you can add tiny programs to your chart that either analyze the market for you or pretend to trade it.
Those tiny programs are written in a language called Pine Script. Don't worry about learning it right now. The key idea is that Pine Script is TradingView's own mini-language, made specifically for charts and tests. It's short, it's readable, and you can copy-paste your way to a huge amount of what you need.
The two kinds of scripts you can add to your chart
Every Pine Script you'll ever meet on TradingView is one of two types:
- An Indicator, which starts with the line indicator("...").
- A Strategy, which starts with the line strategy("...").
That single word — indicator vs strategy — tells TradingView what job the script is supposed to do.
And that's it. That's the fork in the road.
Indicator vs Strategy — the one-sentence difference
Here is the whole article in one sentence.
An indicator shows you information about the market. A strategy tests whether trading on that information would have actually worked.
That's it. Copy that sentence into your notes app. If you forget everything else, remember that.
Let's unpack it.
Indicator = shows information
An indicator is a script whose only job is to show you something on the chart. Maybe it draws a line, maybe it paints a colored box, maybe it shoots out an arrow when a condition is met. It's informational. It doesn't decide what you do with that information — that's your job. Think of it as a flashlight. A really smart flashlight, maybe, but still a flashlight.
Strategy = tests trades
A strategy is a script that takes a rule — "buy when X happens, sell when Y happens" — and simulates those trades on historical data. Then it shows you a report card: how much money you would have made or lost, how often the idea worked, how deep the drawdowns got, how many trades per day it would have fired. Strategies don't just see. They commit. At least in simulation.
A real-life analogy you'll actually remember
Imagine you want to drive to a friend's house tomorrow.
- An indicator is the weather app on your phone. It tells you "70% chance of rain at 3 p.m." That's useful. It's information. But the weather app doesn't make any decision for you.
- A strategy is a journey planner where you lock in a rule — "I'll leave at 2:30 unless there's heavy rain, in which case I'll leave at 4:00" — and then someone re-runs that rule against the last 365 days of weather to tell you: "You would have arrived on time 82% of the time, and been more than 30 minutes late 4% of the time."
Both tools are valuable. But only one of them answers: "Would my plan have actually worked?"
What each one is actually built for
This is important: an indicator isn't bad, and a strategy isn't automatically good. They're built for different jobs. Using them well means choosing the right tool for the right stage of your thinking.
When to reach for an indicator
An indicator is the right tool when:
- You trade manually, with your own eyes and your own judgment.
- You want a cleaner chart — for example, a line that shows you the overall trend without all the noise.
- You make decisions with context ("is the news bad today?"), not with fixed mechanical rules.
- You just want alerts. For example: "Send me a notification whenever the RSI drops below 30." — and then you'll decide from there.
If you're still figuring out whether an idea even makes visual sense, an indicator is perfect. It's the sketchpad.
When to reach for a strategy
A strategy is the right tool when:
- You have clear, unambiguous rules for entering and exiting trades. ("Buy when the fast EMA crosses above the slow EMA. Sell when it crosses back below. Put the stop 1.5 ATR away. Take profit at 2× the stop distance.")
- You want to test before risking real money.
- You care about numbers: win rate, drawdown, profit factor, expectancy — all terms we'll define in a moment.
- You want to remove emotion from the decision. ("I'll do what the test says works, not what I feel like on Tuesday.")
The moment you notice yourself saying "I wonder if this actually works historically" — that's the moment you've outgrown the indicator.
|
Indicator |
Strategy |
|
|---|---|---|
|
Main job |
Shows information |
Tests trades |
|
Gives a P&L? |
No |
Yes |
|
Good for manual trading? |
Yes |
Less so |
|
Good for automation? |
Not really |
Yes |
|
Forces you to define exact rules? |
No |
Yes |
The same idea, two ways — an EMA crossover example
Let's make this real. We'll use one of the oldest, simplest ideas in all of trading: the EMA crossover.
The idea in plain English
An EMA (Exponential Moving Average) is just a smoothed version of price. Instead of looking at the jittery ups and downs bar by bar, an EMA gives you a cleaner line that follows the general direction. The smaller the "length" number (like 20), the more responsive the line. The bigger the number (like 50), the slower and smoother the line.
A crossover is when a faster line crosses above (or below) a slower line. Think of it like two runners: when the faster runner passes the slower one, something about the race has probably changed.
The idea we're going to test is just:
- Buy when the 20-period EMA crosses above the 50-period EMA.
- Sell when the 20-period EMA crosses below the 50-period EMA.
That's the whole strategy. Nothing fancy. Not because it's amazing, but because it's the perfect teaching example.
Now let's see it written two ways.
| Indicator Code |
|
In plain English, this script does four things:
- Asks for two numbers (the fast EMA length and the slow EMA length), with sensible defaults of 20 and 50.
- Calculates those two EMAs on the closing price of every candle.
- Watches for crossovers, and only counts them once the candle is fully closed (that's what barstate.isconfirmed means — more on that shortly).
- Draws the lines, plots little triangles where crosses happen, and lets you set up alerts.
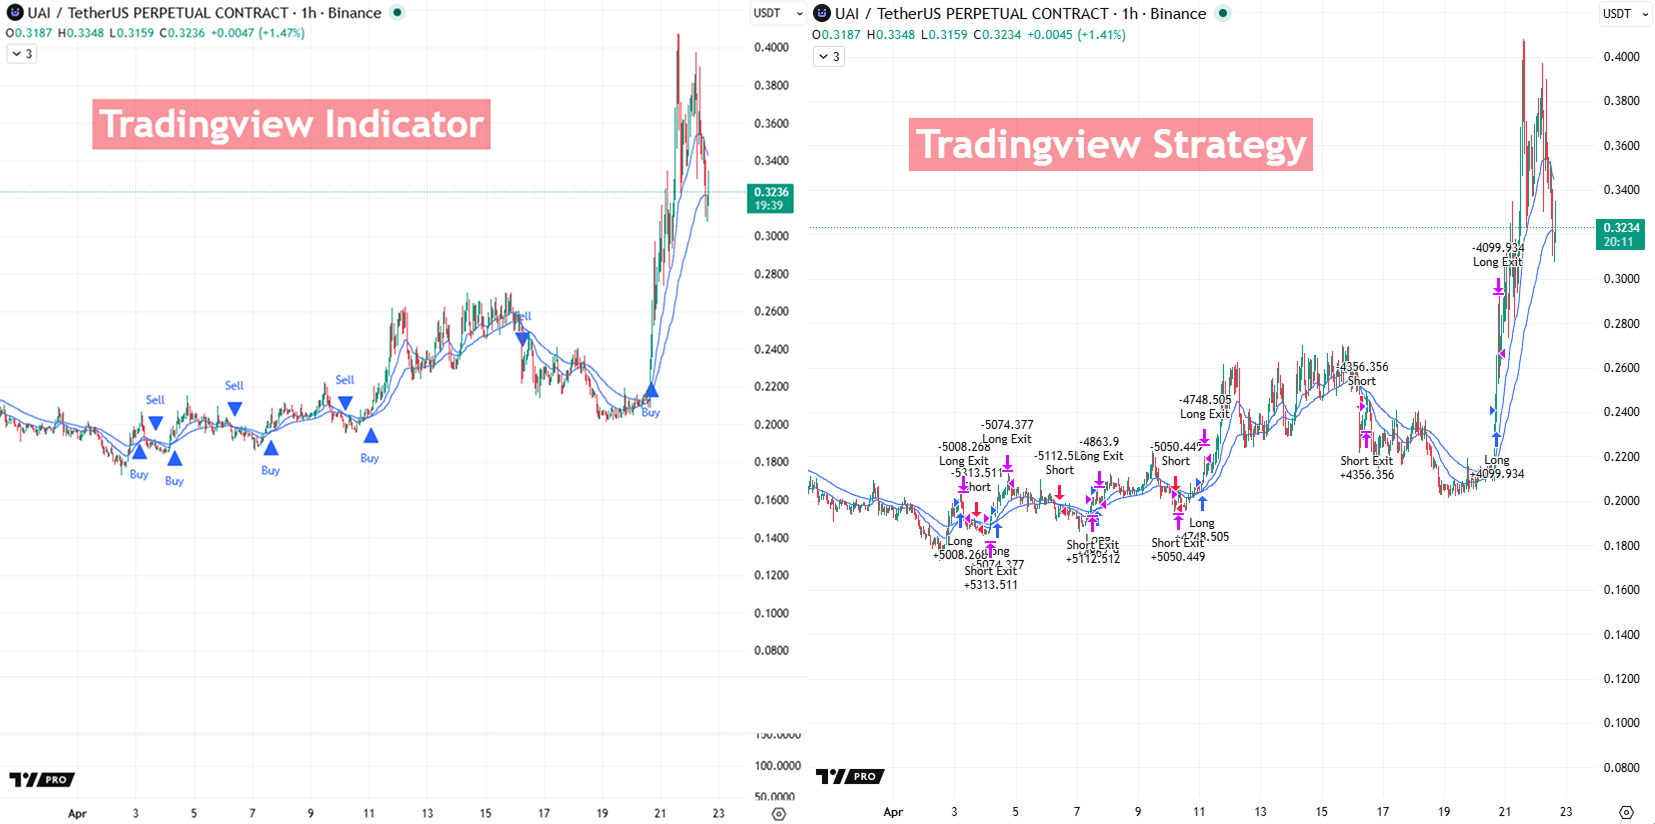
And that's it. It sees. It paints. It beeps. It does not trade. It does not score.
The strategy version (same idea, but testable)
Now watch what happens when we change indicator(...) to strategy(...) and add a few more lines.
| Strategy Code |
   //@version=6
   strategy(
        "EMA Cross Strategy",
        overlay = true,
        initial_capital = 10000,
        default_qty_type = strategy.percent_of_equity,
        default_qty_value = 10,
        pyramiding = 0,
        commission_type = strategy.commission.percent,
        commission_value = 0.10,   // 0.10% per order
        slippage = 2,              // 2 ticks
        calc_on_every_tick = false,
        process_orders_on_close = false
   )

   fastLen = input.int(20, "Fast EMA", minval = 1)
   slowLen = input.int(50, "Slow EMA", minval = 1)
   atrLen  = input.int(14, "ATR Length", minval = 1)
   stopATR = input.float(1.5, "Stop ATR", minval = 0.1, step = 0.1)
   rr      = input.float(2.0, "Reward/Risk", minval = 0.5, step = 0.1)

   fastEma = ta.ema(close, fastLen)
   slowEma = ta.ema(close, slowLen)
   atrVal  = ta.atr(atrLen)

   longSignal  = ta.crossover(fastEma, slowEma) and barstate.isconfirmed
   shortSignal = ta.crossunder(fastEma, slowEma) and barstate.isconfirmed

   if longSignal
       strategy.entry("Long", strategy.long)

   if shortSignal
       strategy.entry("Short", strategy.short)

   if strategy.position_size > 0
       longStop  = strategy.position_avg_price - atrVal * stopATR
       longLimit = strategy.position_avg_price + atrVal * stopATR * rr
       strategy.exit("Long Exit", from_entry = "Long", stop = longStop, limit = longLimit)

   if strategy.position_size < 0
       shortStop  = strategy.position_avg_price + atrVal * stopATR
       shortLimit = strategy.position_avg_price - atrVal * stopATR * rr
       strategy.exit("Short Exit", from_entry = "Short", stop = shortStop, limit = shortLimit)

   plot(fastEma, "Fast EMA")
   plot(slowEma, "Slow EMA")
|
Don't panic. Let's walk through the new stuff in human words.
- strategy(...) instead of indicator(...). This is the magic line. Everything else is possible because of this single word.
- initial_capital = 10000. "Pretend we started with $10,000." Just a starting balance for the simulation.
- default_qty_type = strategy.percent_of_equity, default_qty_value = 10. "Each trade risks 10% of the current account." Much more realistic than "always trade 1 BTC."
- commission_type and commission_value = 0.10. "Charge a 0.10% fee on every entry and every exit." Matches real exchange fees.
- slippage = 2. "Assume the price we actually get is 2 ticks worse than we'd hoped." Reality, in a single line.
- strategy.entry("Long", strategy.long). "When the condition is true, open a long trade called 'Long'." This is the actual hypothetical trade being placed.
- strategy.exit(...) with stop and limit. "Close the trade either with a stop-loss or a take-profit, whichever hits first." In this script, the stop is placed 1.5 ATR below entry, and the take-profit is at 2× the stop distance. (ATR is just a measure of how volatile the market is — bigger ATR, wider stop.)
Everything else — the EMAs, the crossovers, the confirmed bars — is identical to the indicator version. Same idea. Same signals. Same logic. What changed is that now the script can act, and TradingView can score it.
The three lines that turn one into the other
If you really want to see the DNA swap, these are the lines that transform a decorative indicator into a testable strategy:
- strategy(...) instead of indicator(...).
- strategy.entry("Long", strategy.long) when the signal is true.
- strategy.exit(...) with a stop-loss and a take-profit.
That's it. Everything else is polish — commissions, slippage, position sizing. But those three lines are the heart of it.
The Strategy Tester — where ideas meet reality
The moment you load a Strategy Script onto a chart, TradingView opens a panel at the bottom called the Strategy Tester. This is where the magic — and the danger — lives.
What backtesting actually is (and isn't)
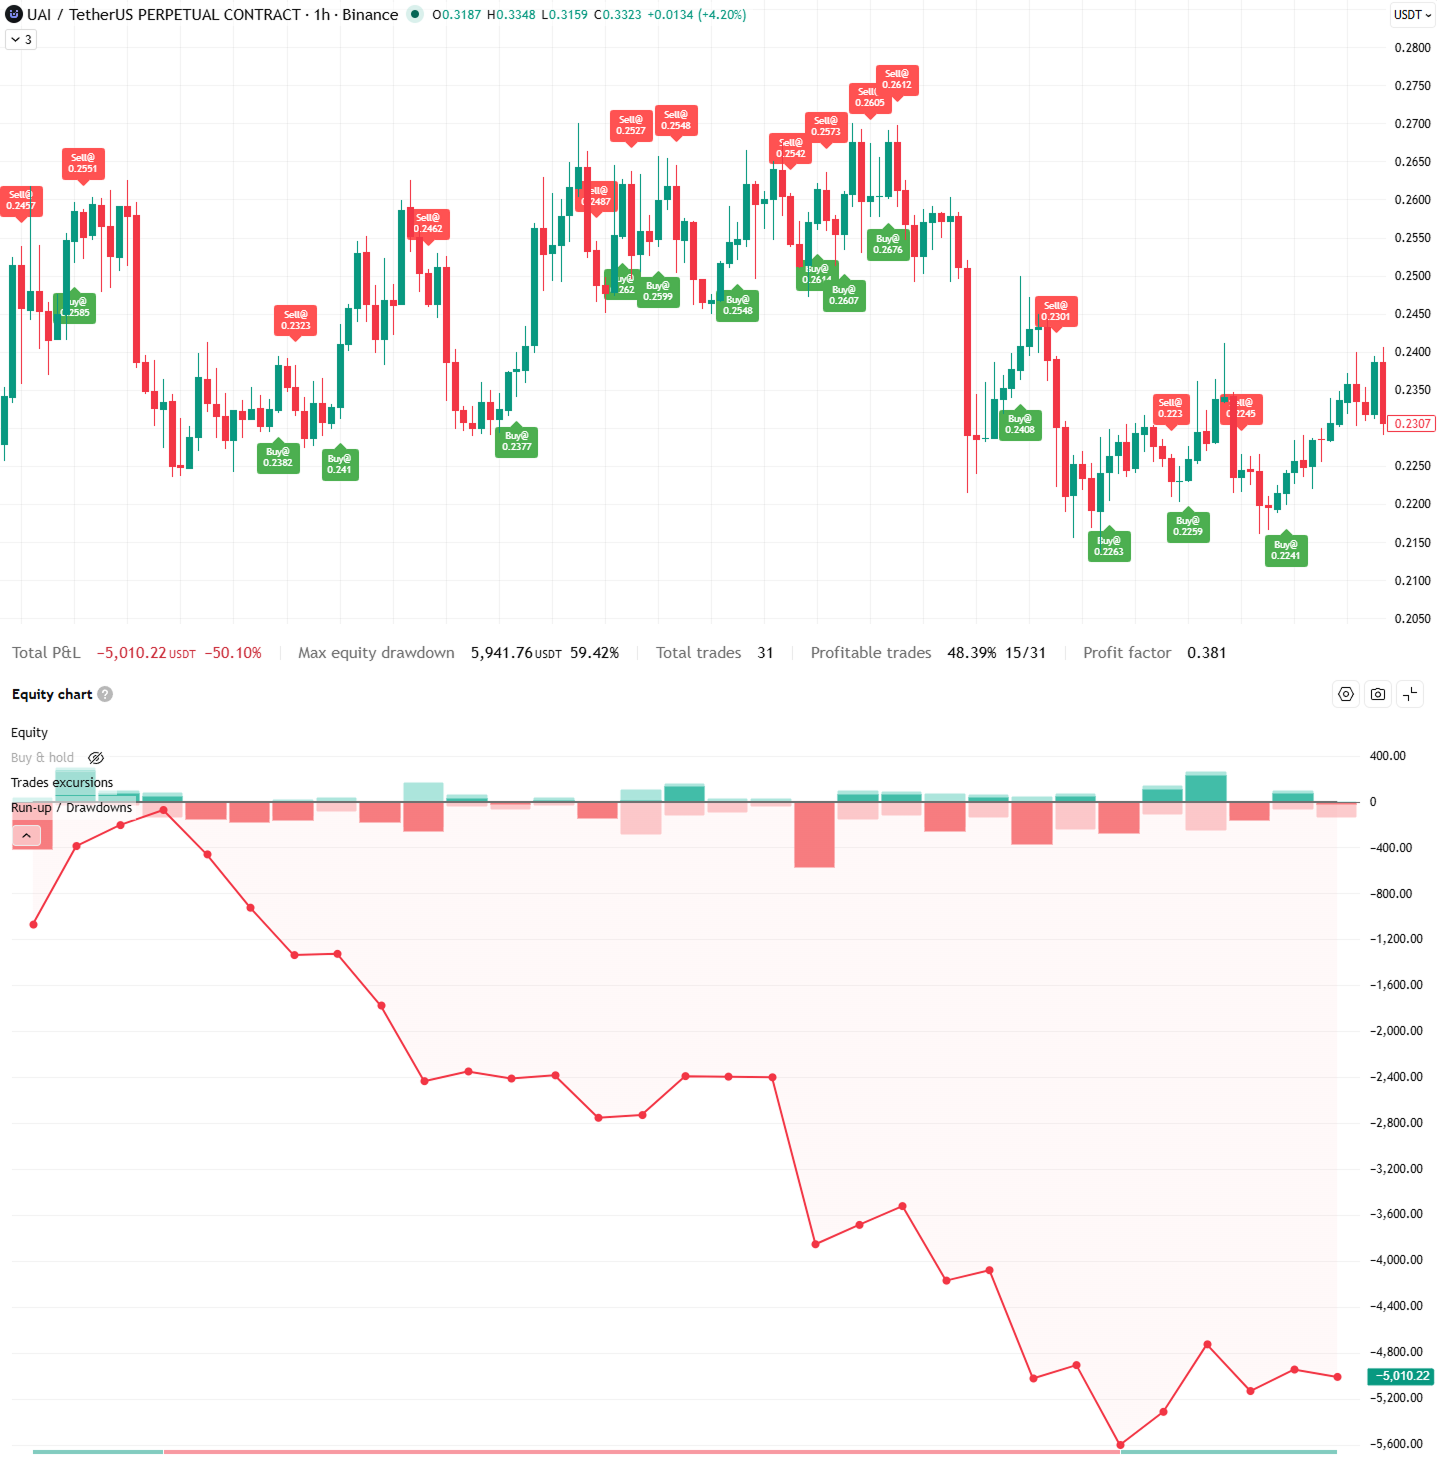
A backtest is exactly what it sounds like: testing your strategy back on data that has already happened. TradingView walks your rule forward bar by bar, as if you were living through each candle in order, and records every hypothetical trade it would have made. What backtesting is: a way to see if your idea has ever worked, on one slice of history, under a specific set of assumptions. What backtesting is not: a promise about the future. A historical fact proven on a single dataset is not a prediction. Ever.
The numbers that matter most for a beginner
The Strategy Tester will spit out dozens of metrics. At this stage, focus on five:
- Net Profit — the total money the strategy made or lost over the test. Positive is good. Big isn't always better (see drawdown).
- Win Rate — the percentage of trades that ended profitably. A 45% win rate with big winners can beat an 80% win rate with tiny winners and huge losers. Don't fall in love with this number alone.
- Max Drawdown — the deepest drop from a peak in your equity. This tells you how much pain you would have had to sit through. A 60% drawdown means at some point you'd have been down 60%. Most people quit way before that.
- Profit Factor — total winning dollars divided by total losing dollars. Above 1.0 means you're net positive. Above ~1.5 for a realistic strategy is genuinely encouraging.
- Expectancy — the average profit (or loss) you can expect per trade. This is the "what would happen on average" number. It's the most honest single metric.
Why the same idea can look amazing one year and terrible the next
Here's a sobering truth: markets change. A strategy that worked beautifully during Bitcoin's 2020–2021 bull run can look disastrous in 2022's bear market. The EMA cross that was profitable on BTC might be unprofitable on ETH — and terrible on SOL.
A single backtest on a single asset across a single period tells you almost nothing by itself. It's one data point. Treat it like one.
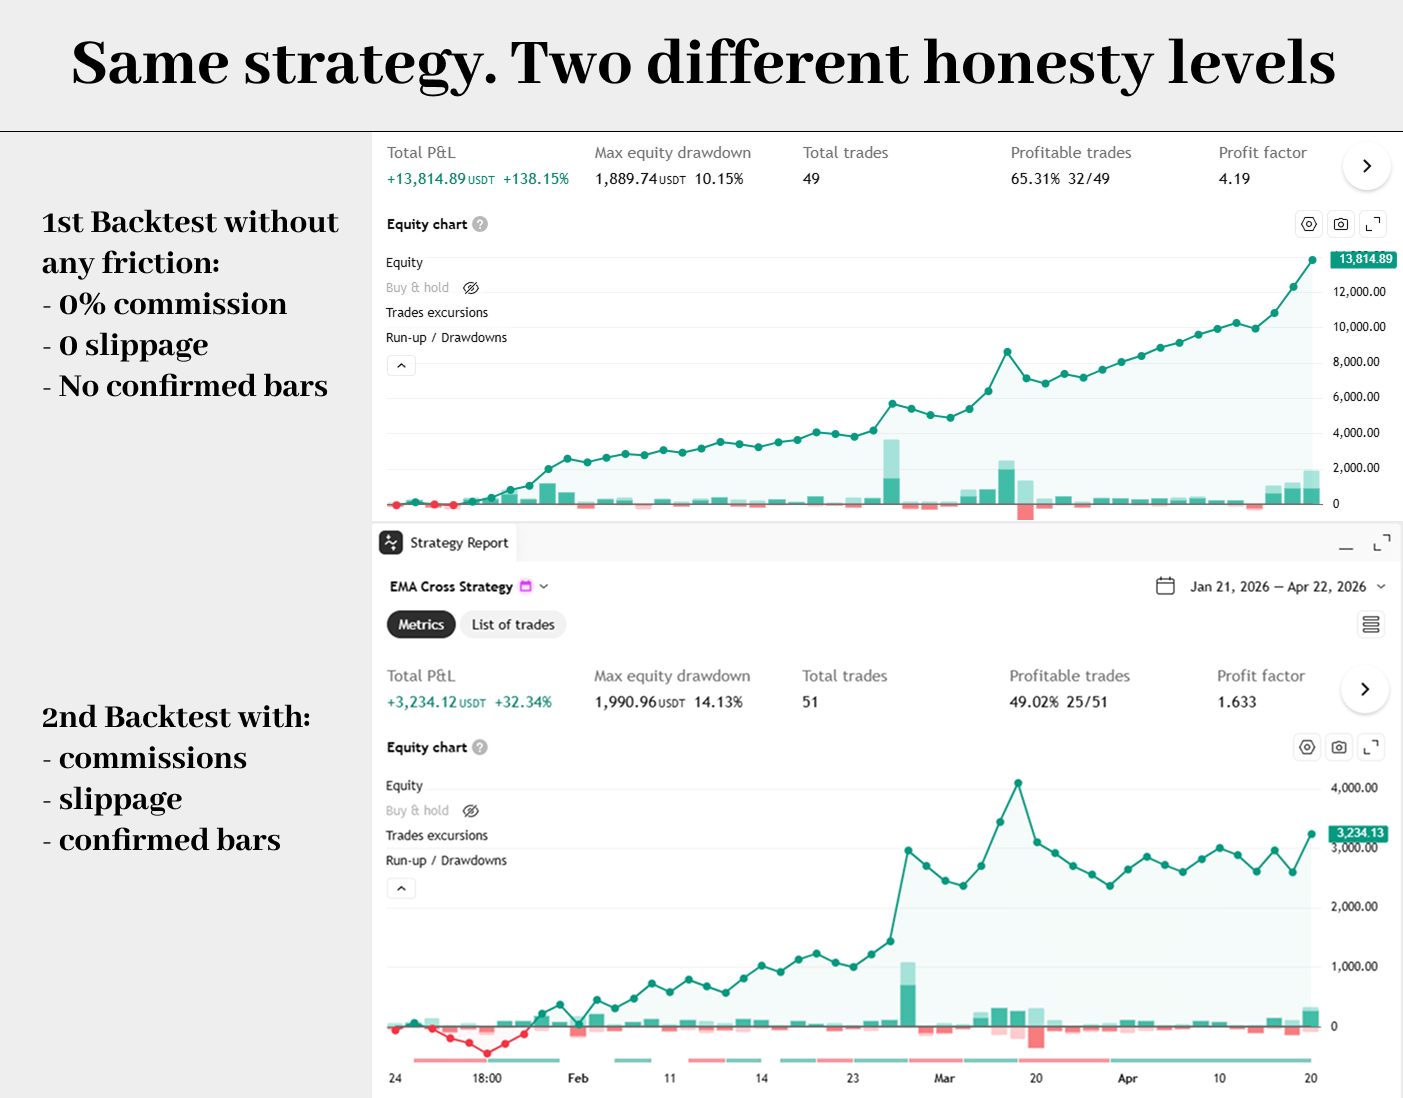
Why most backtests lie (and how a good Strategy Script stops that)
Now we're getting to the part most beginners skip — and it's the part that separates "I made a pretty chart" from "I built something real."
When you first run a backtest, TradingView has to make assumptions about the frictions of real life: fees, price changes between decision and execution, whether a signal is final or still moving. Those assumptions are the difference between a backtest you can trust and one that's going to wreck your account.
Commissions — the fee for every trade
Commission is the fee the exchange charges you for each trade, usually a tiny percentage. In crypto, 0.075–0.2% is typical. Sounds small. Isn't.
If your strategy trades twenty times a day, you're paying that fee forty times (once to enter, once to exit). A strategy that shows +30% without commissions might show +3% once you include them. A strategy that shows +3% without commissions might show −5% with them.
The strategy above already sets commission_type = strategy.commission.percent and commission_value = 0.10, which tells TradingView: "Charge 0.10% on both entries and exits."
Slippage — when the price you wanted is gone
Slippage is the gap between the price you wanted and the price you actually got. Imagine you press "buy" at $50,000 for Bitcoin — but by the time your order actually fills, the price is $50,050. That $50 difference is slippage.
Slippage happens because markets move, and because big orders can "eat" through multiple price levels. In TradingView, slippage = 2 tells the backtest to pretend every entry and exit happens 2 ticks worse than ideal.
Spread — the gap between buy and sell
Spread is closely related. It's the small gap between the price you can sell at and the price you can buy at, at any moment. If Bitcoin's bid is $49,998 and ask is $50,002, the spread is $4. On a single trade it's tiny. Across thousands of trades, it adds up. Slippage settings can be used to roughly cover spread in backtests.
Repainting — the signal that "appears" and then vanishes
This is the one that burns more beginners than anything else.
Repainting is what happens when a signal appears on your chart while a candle is still forming, and then quietly disappears once that candle closes. It's like a referee waving a goal, then changing their mind, and the replay showing no goal ever happened.
In the EMA strategy above, this line is the guardrail:
longSignal = ta.crossover(fastEma, slowEma) and barstate.isconfirmed
barstate.isconfirmed means "only count this signal once the bar has officially closed." No more ghost arrows.
The strategy version also sets calc_on_every_tick = false. This prevents TradingView from recalculating the script on every tiny price movement, which can cause the backtest and the live behavior to disagree. When a script uses tick-by-tick recalculation, backtests can become less trustworthy and even look different after you reload the chart.
Overfitting — the trap of tuning to the past
Overfitting is the deadliest of all. It's what happens when you keep adjusting your strategy's settings — fast EMA length, stop size, reward/risk ratio — until it shows a beautiful curve on the past, only because you've tortured it into fitting that specific history. You haven't built a strategy. You've built a shape that matches one past.
No Pine code setting can prevent overfitting. You can only prevent it with discipline:
- Pick settings based on reasoning, not trial-and-error.
- Test on data you didn't use to optimize — called out-of-sample data. For example: tune on 2019–2022, test on 2023–2024.
- Test on multiple assets, not just the one that "looked best."
- Remember: the more knobs you tune, the worse this trap gets.
The Heikin Ashi / Renko trap
One last landmine. TradingView's documentation explicitly warns that backtests on non-standard charts — Heikin Ashi, Renko, Kagi, Line Break, Point & Figure, Range — can be unrealistic because those charts use synthetic prices. The prices shown aren't real market prices; they're processed versions.
If you test a strategy on a Heikin Ashi chart and it shows +900%, that's not a discovery. That's an illusion.
Always backtest on standard candlesticks.
Common beginner mistakes (editorial enhancement — added for clarity)
Let's make this concrete. Here are the traps that almost every beginner walks into at least once. If you can avoid these six, you'll be ahead of 90% of people playing with Pine Script.
- Optimizing and judging on the same data. You tune the EMA lengths until the curve looks perfect, then celebrate that perfect curve. That's not a strategy — that's a mirror. Fix: always keep a chunk of data untouched for final validation.
- Trusting backtests on Heikin Ashi charts. The numbers will make you rich on paper and broke in real life. Fix: backtest on standard candlesticks.
- Ignoring commissions "because it's crypto." Crypto fees are small but not zero, and they compound fast. Fix: always set a realistic commission value.
- Celebrating win rate without looking at drawdown. An 80% win rate with occasional 70% drawdowns is not profitable — it's a roller coaster waiting to eject you. Fix: always look at drawdown next to win rate.
- Testing only on one coin. A strategy that works on BTC might be a disaster on DOGE. Fix: run it on at least 3–5 different symbols before trusting it.
- Assuming a great backtest = a great live performance. It doesn't. Backtests are a filter. They remove obviously bad ideas. They don't guarantee good ones.
The honest limits of strategies
To keep this article balanced, let's be clear: a Strategy Script is more honest than an indicator, but that doesn't mean it's automatically profitable.
A well-built strategy forces you to answer questions an indicator never does:
- Where exactly do I enter?
- Where exactly do I exit?
- How big is my position?
- What happens in bad market conditions?
- How much pain (drawdown) am I willing to sit through?
Those are the right questions. Answering them is most of the battle.
But strategies can still mislead you if you ignore:
- Slippage
- Commissions
- Spread
- Repainting
- Overfitting
They can also mislead you if the backtest only covers one type of market (all bull, no bear) or one type of asset (one coin you happen to love).
A strategy is a tool for testing honestly. It isn't a crystal ball. Nothing is.
The practical workflow: Indicator → Strategy → Bot
If you take one mental model away from this article, let it be this progression. This is the path used by almost every trader who successfully automates.
Step 1 — Prototype as an indicator
Start with an indicator. Drop it on a chart. Look at where the signals land. Do they show up at moments that make visual sense? Are they too frequent? Too rare? Do they make you say "huh, that looks like something" or "that looks like nonsense"?
This is the sketchpad stage. No money at risk. No rules locked in. Just eyes and intuition.
Step 2 — Convert into a Strategy Script
Once the visual logic makes sense, convert the indicator into a Strategy Script. Force yourself to write down the exact entry condition, the exact exit condition, the stop-loss, the take-profit, and the position size. If you can't, the idea isn't ready — that's useful information too.
Then run it through the Strategy Tester with realistic commissions, realistic slippage, and confirmed bars only. Look at Net Profit, Win Rate, Max Drawdown, Profit Factor, and Expectancy.
If it survives this stage — with honest settings, not wishful ones — you've got something worth examining more closely.
Step 3 — Validate on fresh data
This is the step most beginners skip. Test the strategy on:
- Periods you didn't optimize on (out-of-sample data).
- Different assets than the one you started with.
- Different timeframes, especially the one you plan to actually trade.
If performance collapses on fresh data, your "strategy" was really just a costume for historical noise. Back to step 1. If performance survives — even in a less shiny form — you've built something real.
Step 4 — Automate it as a bot
Only now does automation make sense. Not before. Because a bot that runs a bad strategy just loses money faster than you could.
How to convert a TradingView Indicator into a Strategy
Let's get very practical. There's no official "one-click" button that turns any indicator into a strategy inside TradingView. But in practice, conversion is surprisingly simple — either by hand or with a little help from an AI assistant.
The manual way: 5 small changes in the Pine Editor
- Change the first line. Replace indicator("...", ...) with strategy("...", ...) and add settings like initial_capital, commission_type, commission_value, and slippage.
- Keep your signals identical. Leave your existing logic (EMAs, RSI, whatever) exactly as it is.
- Add entries. Wherever your indicator would have drawn a "buy" arrow, call strategy.entry("Long", strategy.long). Same for shorts.
- Add exits. Use strategy.exit(...) with a stop-loss and take-profit, ideally based on ATR so they adapt to the asset's volatility.
- Keep barstate.isconfirmed on your signal conditions so you're not chasing phantom, still-forming bars.
Save, open the Strategy Tester, and see what comes out.
The AI-assisted way: using ChatGPT or Claude or DeepSeek as a converter
If you don't want to hand-edit the code, modern AI assistants are genuinely good at this specific task. Give the AI your indicator's source code and a clear description of your rules, and you'll usually get back something close to working on the first try. Iterate on any errors by pasting them back.
A copy-paste prompt you can actually use
Here's a prompt template you can reuse with ChatGPT, Claude, or any capable coding AI. Swap the bracketed parts for your own inputs:
"I'm going to give you a TradingView Pine Script v6 indicator. Please convert it into a full Strategy Script with the following rules:
• Entry: [describe your buy rule]. • Exit: [describe your sell rule], OR a stop-loss at [ATR × multiplier] below entry, OR a take-profit at [reward/risk] × the stop distance. • Use barstate.isconfirmed on all signals to avoid repainting. • Use commission_type = strategy.commission.percent and commission_value = 0.10 for realistic fees. • Use slippage = 2. • Keep input parameters so I can change EMA lengths and risk settings from the UI. • Return only clean, compiling Pine Script v6 code — no explanation unless I ask.
Here is the indicator:
[paste code]"
That single prompt will take you further than most tutorials.
From Strategy Script to trading bot — the final step
You now have a strategy that you trust — at least more than you trust a random indicator's arrows. The next question is: how do you make it trade for you?
What a trading bot actually is
A trading bot for TradingView is a small program that executes trades automatically on an exchange. It doesn't decide the rules — the rules come from your strategy. It just pushes the buttons at the right moments, 24/7, without second-guessing. You won't write this bot from scratch. You don't need to.
How a TradingView strategy talks to a bot
TradingView can send alerts when conditions are met. An alert can be a popup, an email, or — the interesting one — a webhook. A webhook is just a tiny automated message TradingView sends to a URL when your strategy signals an entry or exit. Another application receives that message and acts on it. It connects to your exchange through an API (an authorized doorway you've given it permission to use), places the order, manages the position, and closes it when your strategy says so.
WunderTrading as the beginner-friendly bridge
This is where WunderTrading comes in. It's a platform specifically designed to take TradingView alerts and turn them into real trades on a connected exchange (Binance, Bybit, OKX, Kraken, and others). You don't need to code the bot yourself — you connect your exchange account, create a bot, paste a special webhook URL into your TradingView alert, and your Strategy Script effectively starts trading live.
From the beginner's point of view, the flow looks like this:
TradingView Strategy Script → TradingView Alert (with webhook) → WunderTrading → Exchange → Real trade.
Notice that the Strategy Script is what makes everything downstream possible. No strategy, no bot. You can't automate a gut feeling. You can automate a rule. This is why, for anyone with serious long-term intent, a Strategy Script is almost always more important than an indicator.
Should you still bother with indicators?
Yes. Absolutely. But with a different mindset. After reading this article, you should see indicators differently. They're not the destination. They're the sketchpad — fast, low-commitment, perfect for exploring whether an idea has any visual merit.
Use indicators when:
- You're prototyping a new idea.
- You trade manually and want cleaner signals on your chart.
- You want alerts that still leave room for human judgment.
- You're still figuring out what you're even trying to test.
Use strategies when:
- You want to know if the idea actually works.
- You want numbers, not vibes.
- You want to eventually automate it.
Indicators are the sketch. Strategies are the blueprint. Bots are the building.
All three matter. They just come in order.
Conclusion — The path most traders skip, and why you shouldn't
Go back to the opening scene. The beautiful chart. The arrows in all the right places. The sinking account.
That moment is where most beginners give up on a good idea, not because the idea was bad, but because they never tested it properly. They never left the indicator stage.
The path out of that trap is simple, and it's the same for everyone:
- Use an indicator to sketch the idea. See if it looks like anything.
- Turn it into a Strategy Script. Force yourself to define exact rules, exits, and position sizes. Include realistic commissions and slippage.
- Validate on data and assets you didn't optimize on. This is the step that separates real edge from hopeful illusion.
- When — and only when — the strategy survives honest testing, automate it with a tool like WunderTrading that turns your TradingView alerts into real trades.
Indicators help you see the market. Strategies help you test whether your idea actually works. Bots help you execute the ones that do. Skip any step, and the next one punishes you.
The good news: you don't need to be a programmer. You don't need a finance degree. You don't need to watch the screen all day. You just need to walk the three steps in order, honestly.
Start with one idea. Just one. The simplest idea you already believe in. Write it as an indicator. Rewrite it as a strategy. Backtest it with realistic costs. Validate it on fresh data. And if it survives all of that — hook it up to a bot and let the market prove you right or wrong, without your emotions in the way.
That's the whole game.