


How the Multi-Pair Strategy Works
The multi-pair strategy scans the market for opportunities based on predefined conditions and trend behavior. It focuses on assets that have been declining for some time and starts trading when the downward move begins to lose momentum, which may indicate a potential reversal.
When suitable assets are identified, the strategy launches automated setups across selected pairs. These setups place multiple buy and sell orders at different price levels to capture market fluctuations. The system can run up to 10 active setups at the same time, helping spread exposure across several positions instead of relying on a single asset.
If you are looking for the full product overview and general setup flow, visit the WunderTrading Grid Bot page.
The strategy uses preset rules to determine the step percentage for each trading pair based on market conditions. It also includes a Trailing Profit feature designed to capture additional gains during sharp upward price moves, helping improve overall trade management.
Best Market Conditions for Launching the Strategy
Because the strategy operates only in the long direction, it is usually better to wait until the market has already been in a downward trend for some time. When bearish momentum starts to weaken, traders can look for potential launch conditions using technical indicators on higher time frames.
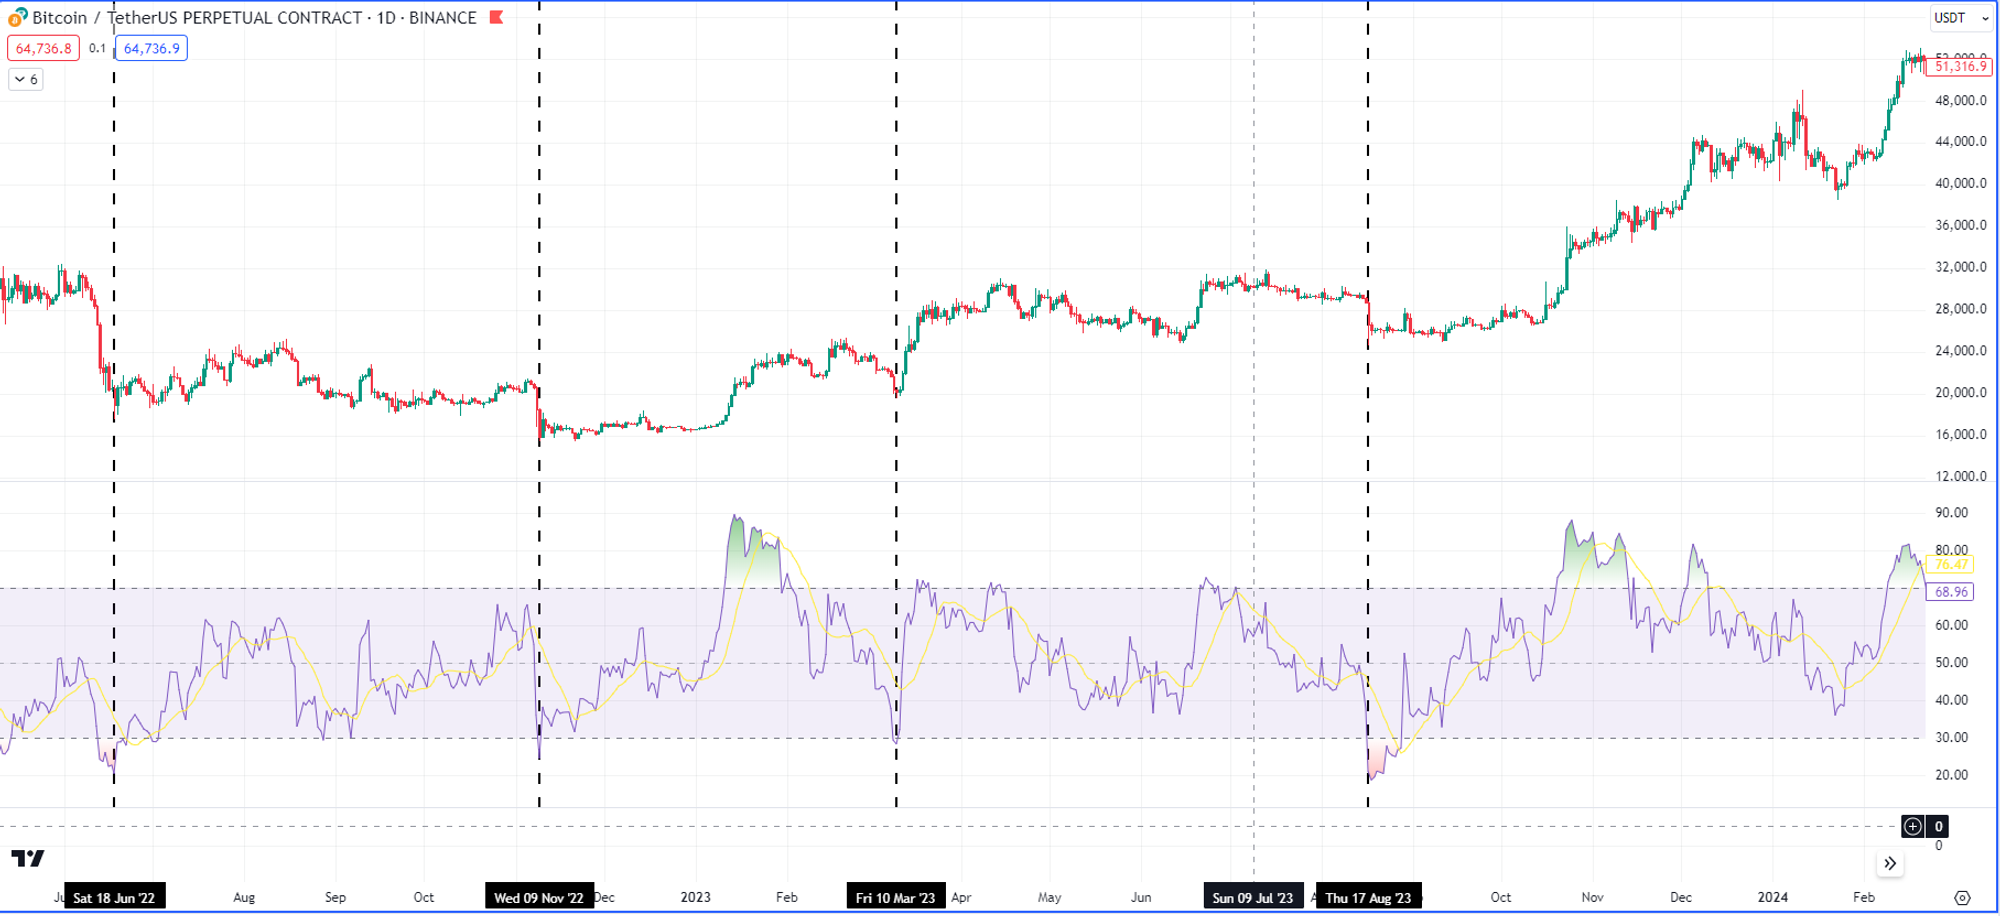
For example, you can use the daily time frame on Bitcoin and apply the RSI indicator. The black vertical line in the chart indicates an example entry point based on RSI(14) falling below 30, which signals an oversold condition. In many cases, after a sharp decline, the market may move into a longer sideways range. During this period, the strategy can capture smaller price fluctuations instead of depending only on a large directional recovery.
This approach may be more flexible than a simple Buy and Hold strategy because it is designed to benefit from smaller market movements during consolidation phases.
Using Trend Indicators to Confirm Bearish Exhaustion
You can also use alternative indicators to evaluate whether bearish momentum is weakening. One example is the SuperTrend indicator, which can help identify possible trend shifts and reduce reliance on RSI alone.
However, indicator-based timing still requires monitoring and manual judgment. Traders should use these signals as decision-support tools rather than guaranteed entry triggers.
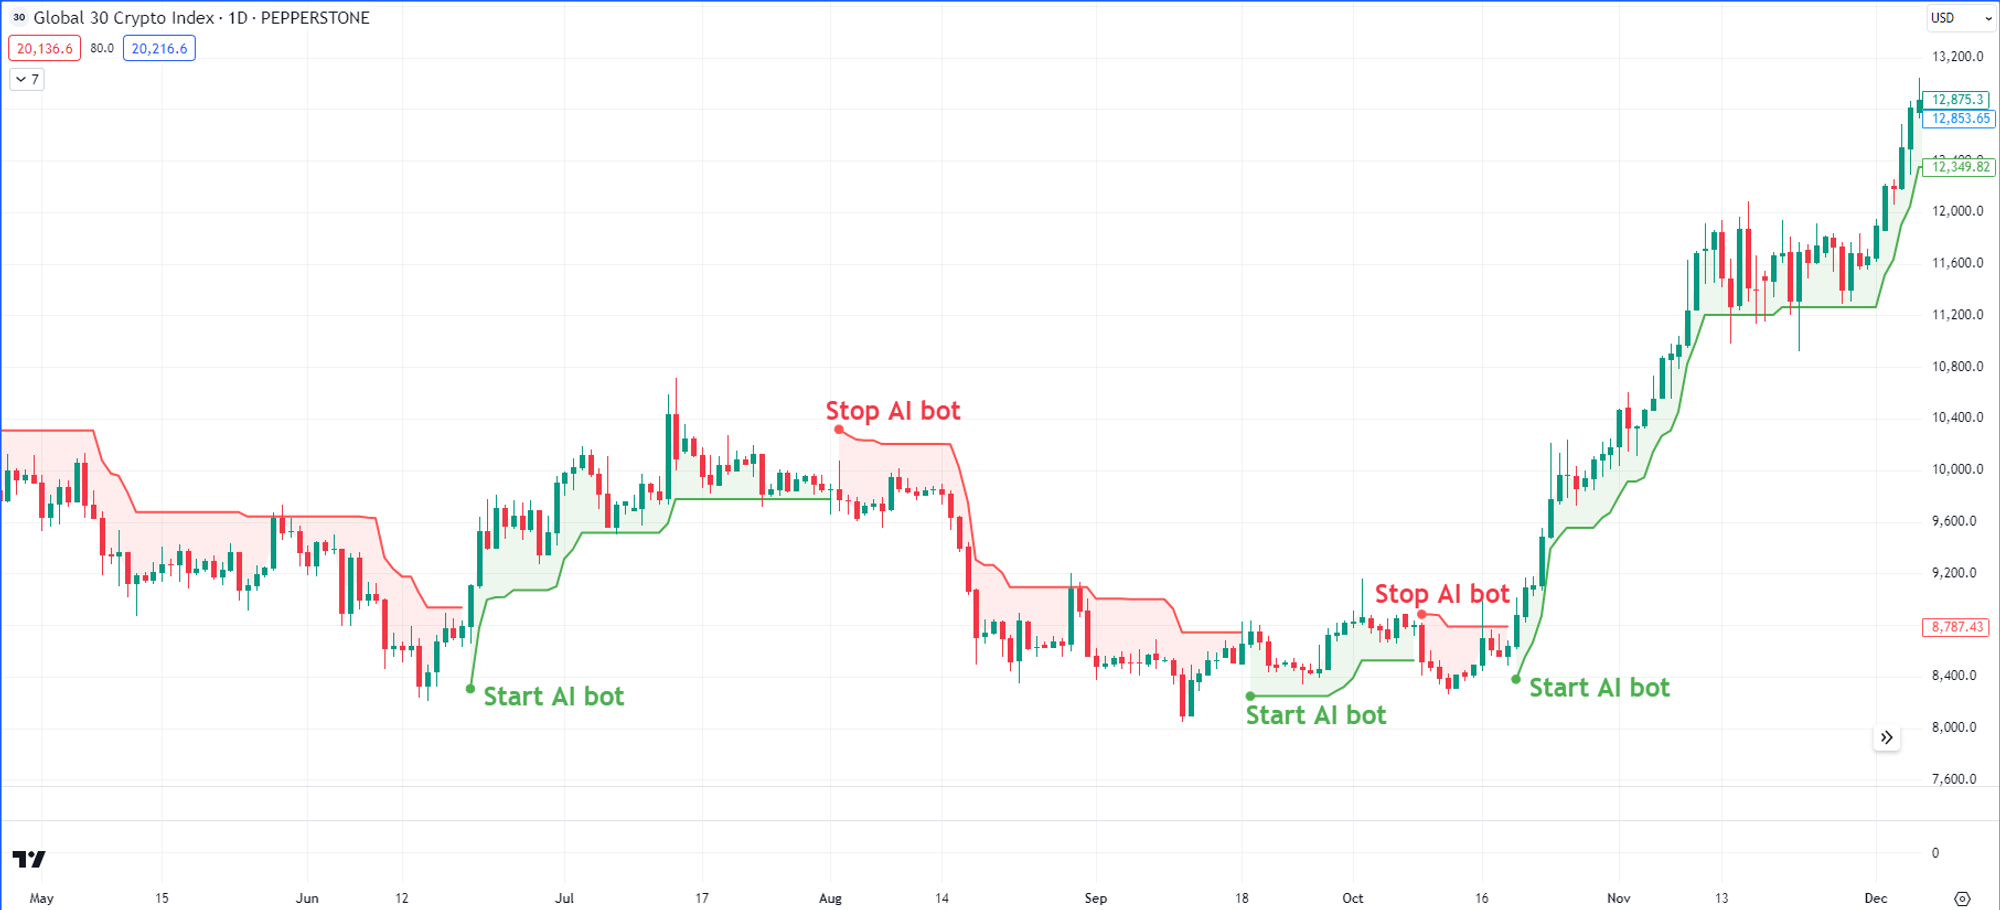
For example, the chart below shows the SuperTrend indicator applied to the Global 30 Crypto Index. In this example, the Average True Range period is set to 100, and the ATR Multiplier is set to 1.7. This configuration helps smooth out price fluctuations and may provide clearer signals for broader market reversals.
Exit Rules: When to Stop or Pause the Strategy
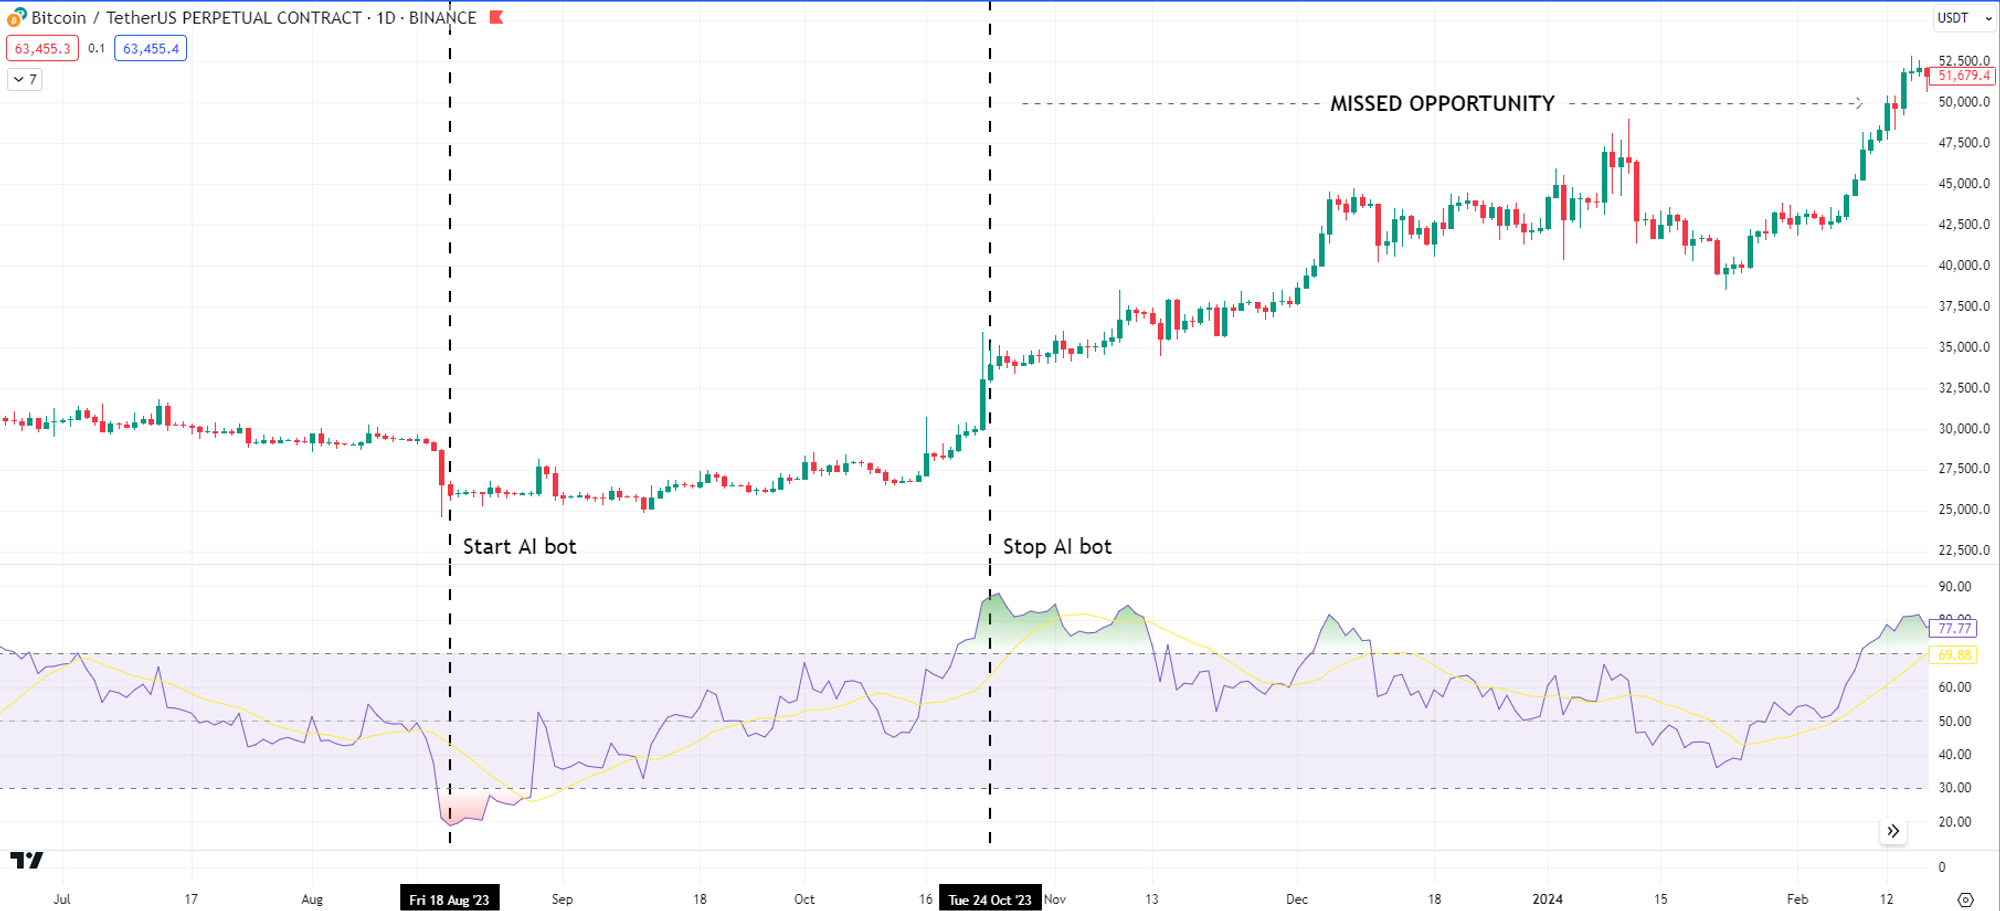
Exit timing is just as important as entry timing. One approach is to use opposite-side indicator signals. For example, if RSI is used as an entry filter, traders may consider stopping the strategy when RSI moves above 70.
This method has a limitation. In bullish markets, RSI can enter overbought territory during the first upward move and then fall while the price continues rising. As a result, exiting only because RSI reaches an overbought level may cause traders to leave too early and miss further upside.
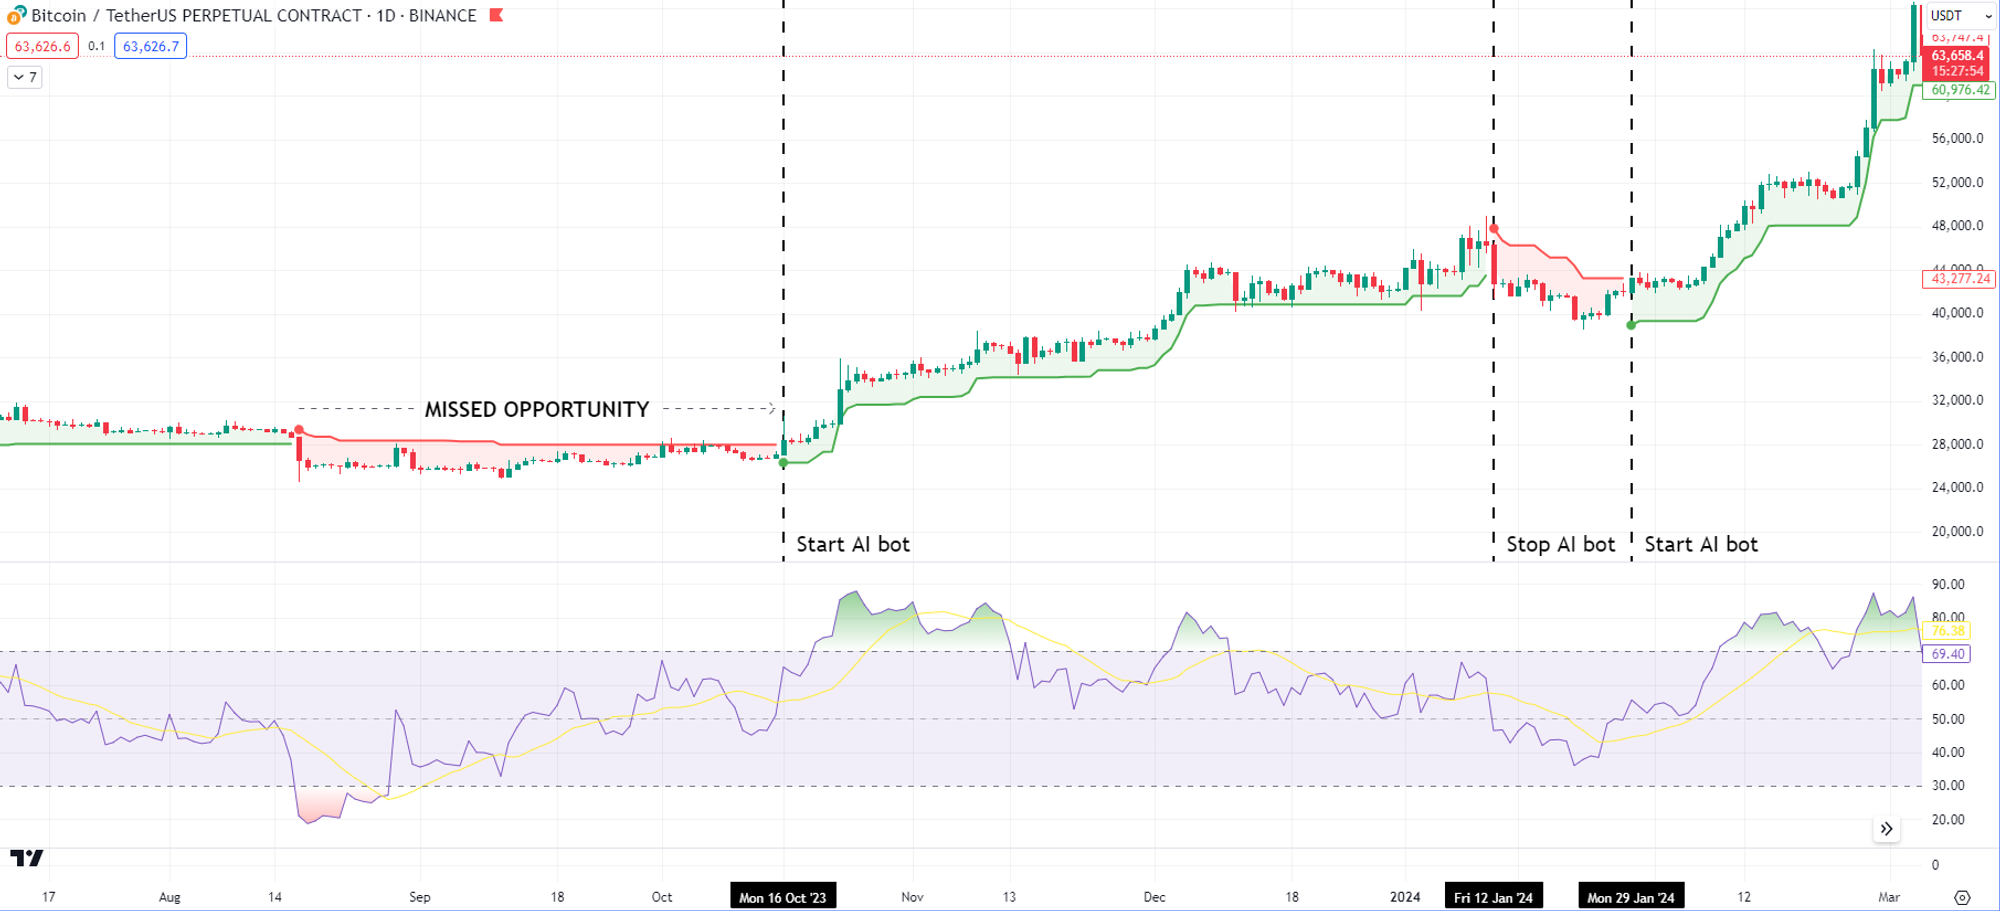
A trend-following indicator such as SuperTrend may provide a more flexible exit method. It can help keep the strategy active while the broader trend remains positive and may also provide re-entry signals during a bull run.
Example Equity Curve and Performance Behavior
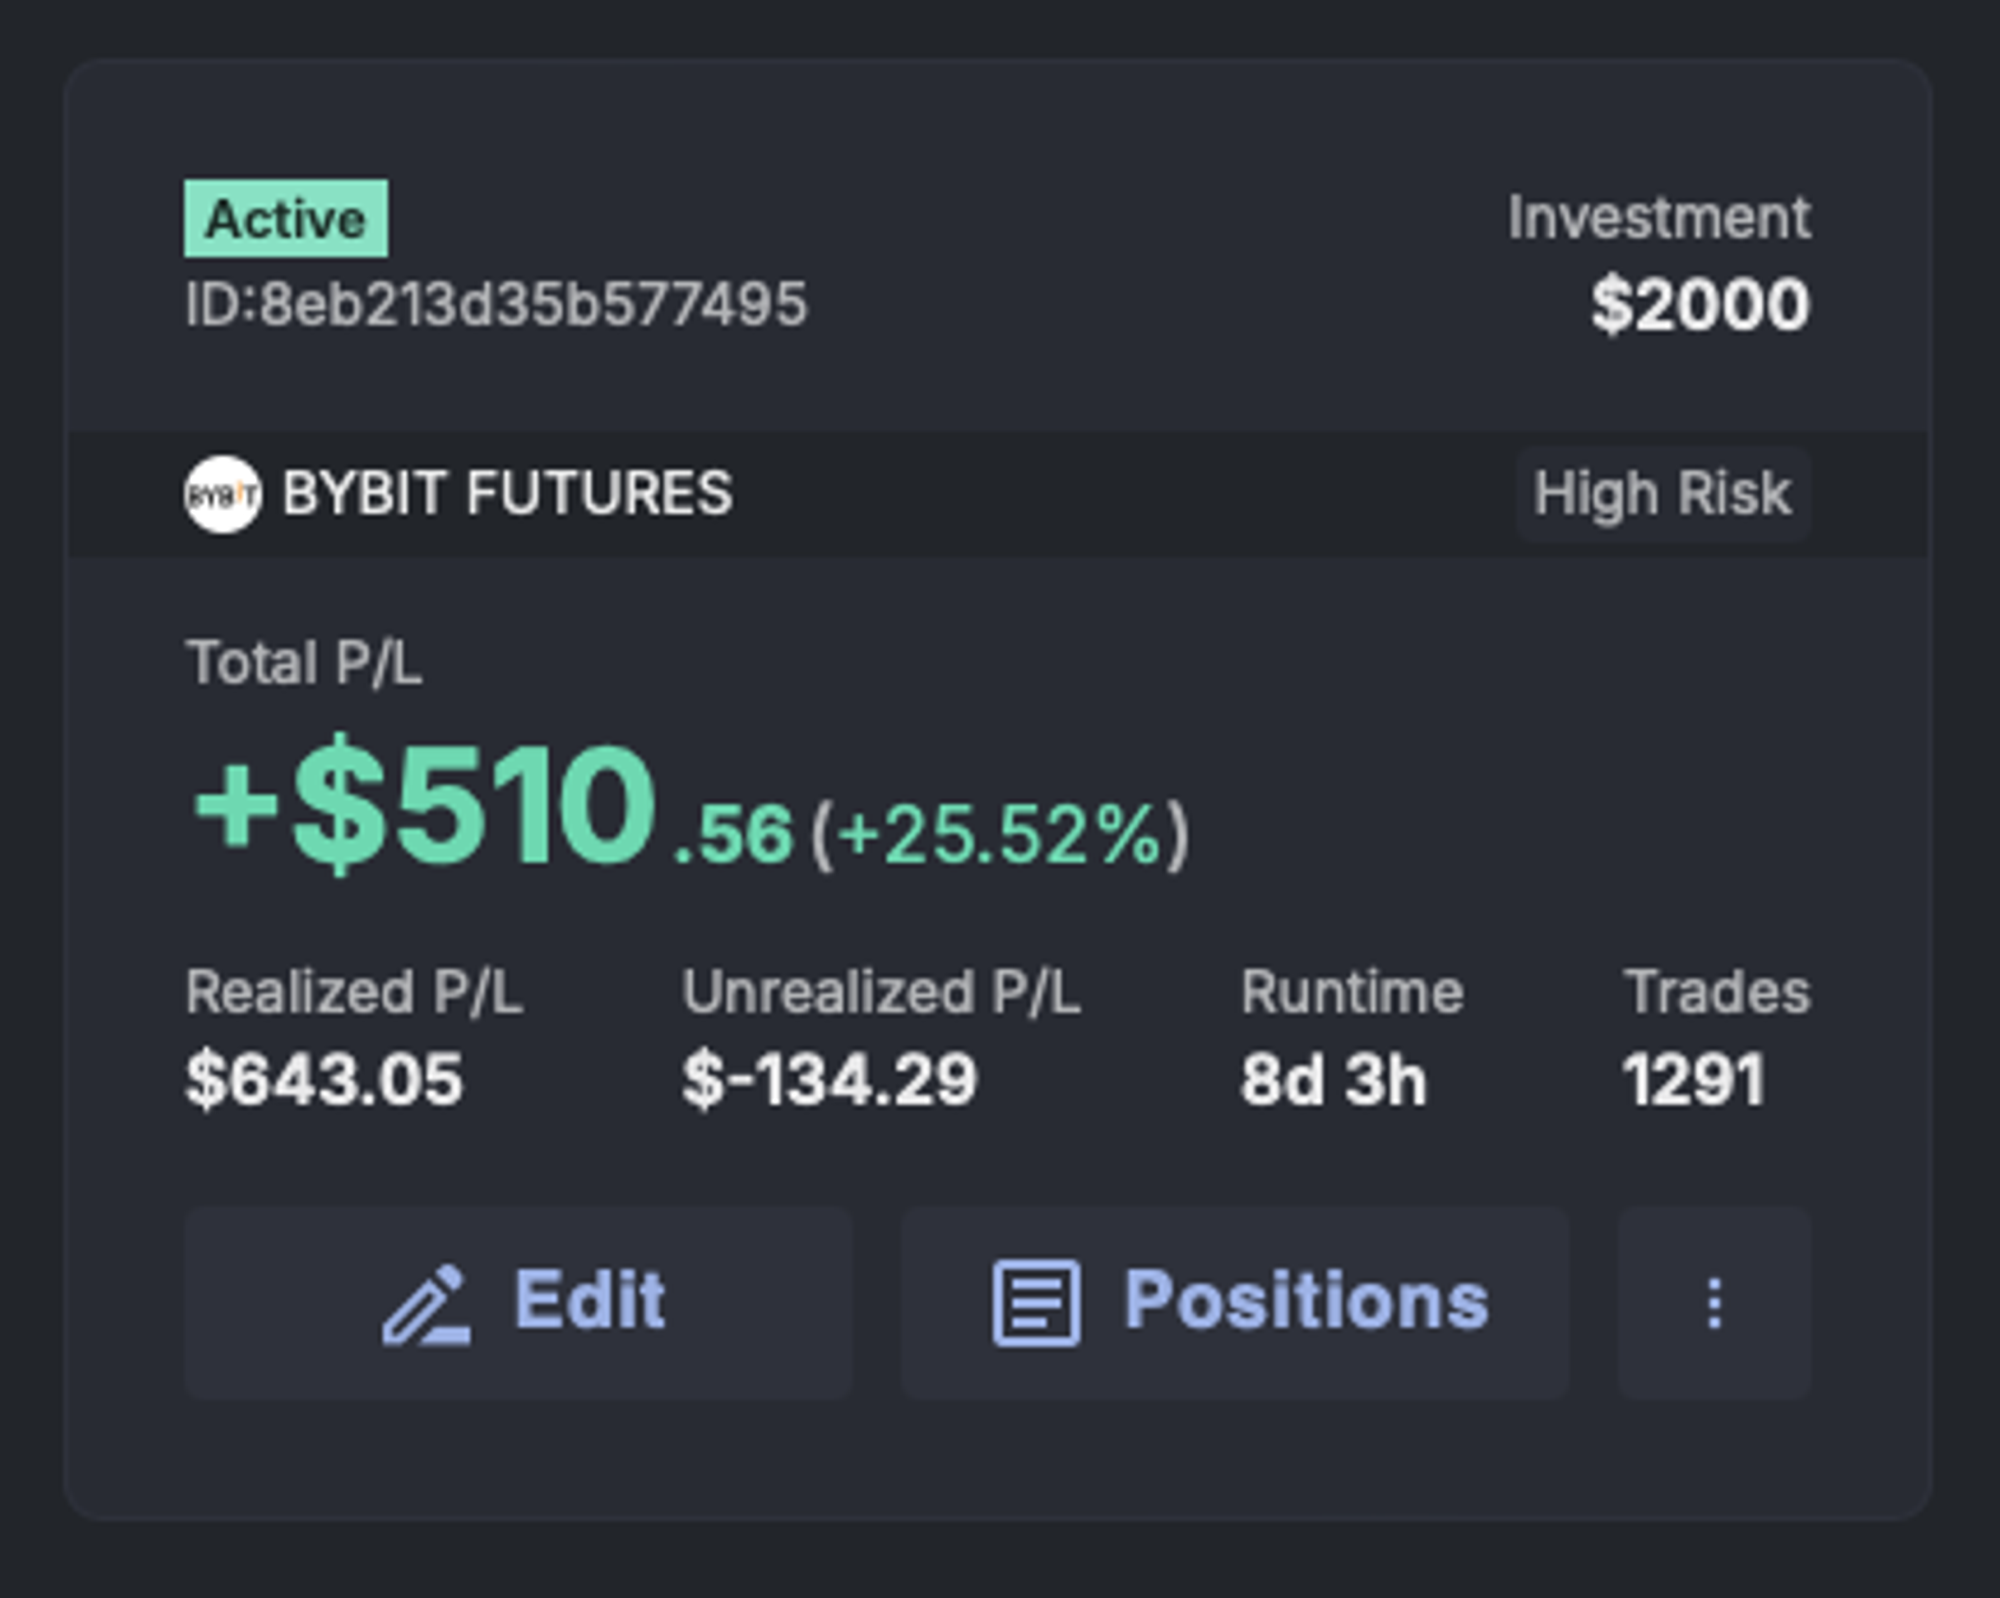
The example below shows a high-risk configuration on the platform. The strategy traded over a period of 8 days, with the entry point based on RSI and the exit point based on the SuperTrend indicator.
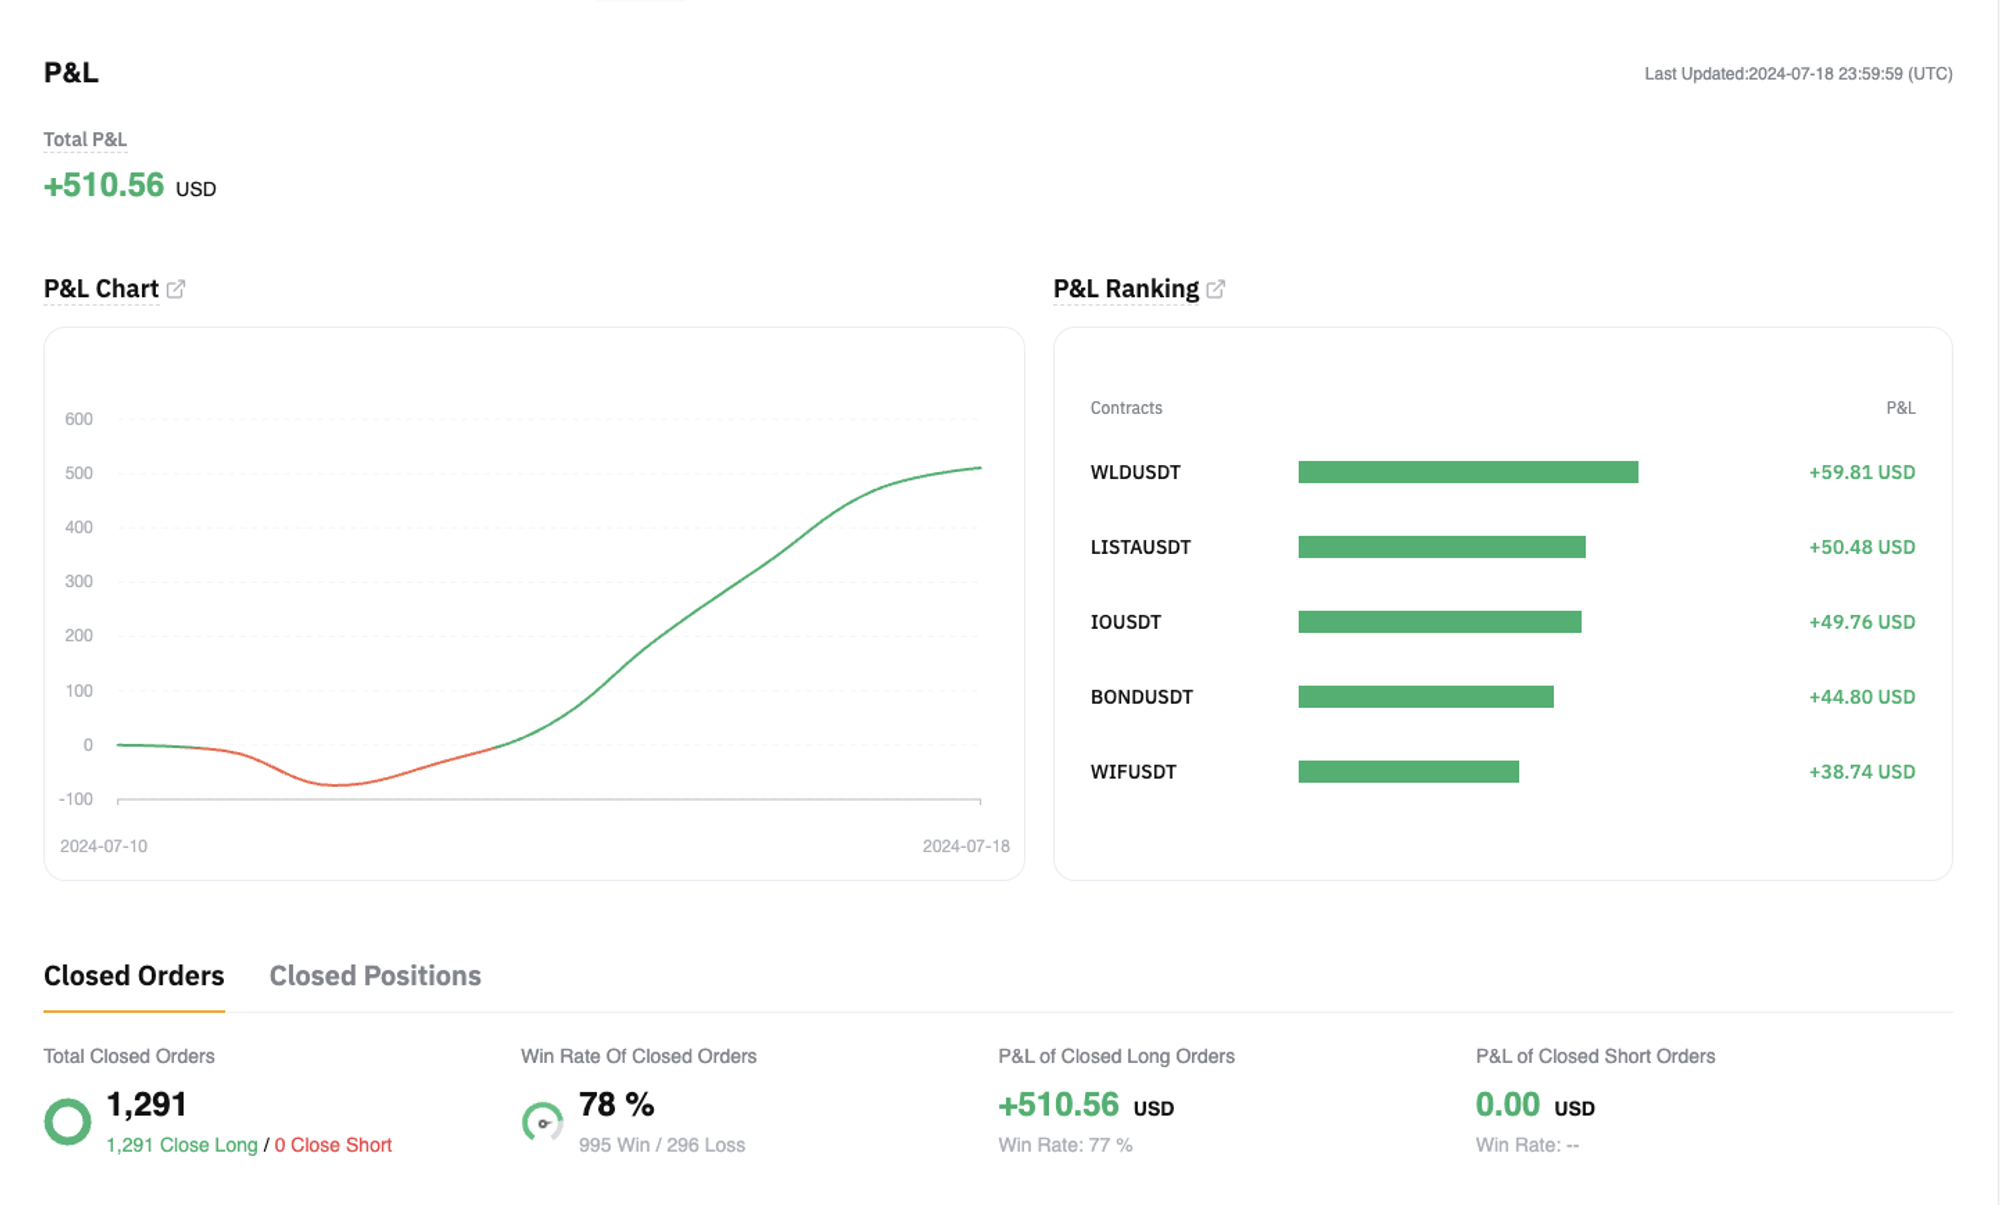
After the initial entry, the market moved lower, which created an unrealized loss. Later, the market recovered and moved upward. As the recovery continued, the strategy began collecting profits from the price movement. The second screenshot shows the P&L curve from the Bybit exchange.
Eight days of trading results with the multi-pair setup from WunderTrading:
Key Risks of Long-Only Multi-Pair Automation
The strategy trades only in the long direction. This means it may perform better in sideways or bullish markets, but can struggle when prices continue to fall.
During a market decline, the system may accumulate unrealized losses as the value of purchased assets decreases. The speed of these losses depends on market volatility, selected risk level, position sizing, and how many pairs are active at the same time.
Higher risk settings may lead to faster loss accumulation, while more conservative settings can reduce exposure but may also limit returns in favorable conditions.
- Low Risk: Each trade uses about 5% of your investment.
- Balanced Risk: Each trade uses about 10% of your investment.
- High Risk: Each trade uses about 20% of your investment.
Important: Keeping the strategy active during a strong bear market can lead to severe losses or complete account liquidation, especially when using high-risk settings.
Practical Tips for Managing Multi-Pair Exposure
- Create multiple low-risk setups with different entry times to diversify exposure.
- Define clear entry and exit conditions before launching the strategy.
- Use higher-time-frame indicators to avoid launching too early during a sell-off.
- Avoid high-risk settings when the market is still in a strong downtrend.
- Monitor unrealized drawdown, not only realized profit.
- Pause or stop the strategy when market conditions no longer match the original setup.