


Ever watched a promising stock continue to decline and wondered when—or if—it would finally reverse course? Many traders miss golden opportunities because they can’t distinguish between a continued downtrend and the early signs of a bullish reversal. Understanding the falling wedge pattern gives you a powerful advantage: the ability to identify when selling pressure is exhausting. This period is known as the consolidation phase, where the market prepares for a potential reversal. A new uptrend may be forming, as the falling wedge acts as a bullish reversal pattern and a technical formation that signals a shift in market direction. In this comprehensive guide, we’ll explore how to spot, validate, and trade this pattern across stocks, forex, and cryptocurrency markets, combining it with supporting indicators to maximize your success rate.
The falling wedge is a key chart pattern in technical analysis. It belongs to the broader family of wedge chart patterns, and its completion often results in a bullish breakout and a clear bullish signal for traders. For context, the rising wedge pattern is the bearish counterpart to the falling wedge.
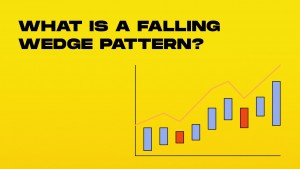
Introduction to Chart Patterns
Chart patterns are a cornerstone of technical analysis, offering traders valuable insights into the likely direction of price movement and the potential for trend reversals. Among the many chart patterns used by traders, the falling wedge pattern stands out as one of the most reliable and widely recognized. This bullish pattern forms when two converging trend lines slope downward, encapsulating a period where an asset’s price is in a downward trend but the pace of decline is gradually slowing.
The falling wedge pattern occurs as the price makes a series of lower highs and lower lows, but with each successive move, the distance between the highs and lows narrows. This creates two converging trend lines that slope downward, signaling a contraction in the price range and a decrease in trading volume. As the pattern develops, it often indicates that selling pressure is waning and a potential reversal in trend direction may be on the horizon. For traders, recognizing this pattern on a price chart can provide valuable insights into a potential trend reversal, helping them anticipate when a downward trend might be coming to an end and a new bullish phase could begin.
By understanding how the falling wedge pattern forms and the significance of its two converging trend lines, traders can better position themselves to capitalize on potential reversals. This makes the falling wedge not only a key chart pattern in technical analysis but also a powerful tool for identifying high-probability trading opportunities.
Technical Analysis and Chart Patterns
Technical analysis is the practice of evaluating securities by studying statistical trends and patterns in price movements, as well as other market data. At the heart of technical analysis are chart patterns, which provide a visual framework for interpreting market sentiment and forecasting future price action. The falling wedge pattern is a prime example of how chart patterns can be used to spot potential shifts in market direction.
As a reversal pattern, the falling wedge pattern is particularly useful for identifying potential buying opportunities during a downtrend. By analyzing the slope and convergence of the trend lines that define the wedge pattern, along with changes in trading volume, traders can gauge when a downward move is losing momentum and a bullish reversal may be imminent. This approach allows traders to make more informed decisions about when to enter or exit trades, using the falling wedge pattern as a guide within the broader context of technical analysis.
Incorporating chart patterns like the falling wedge into a technical analysis strategy helps traders move beyond guesswork, providing a structured way to interpret price action and anticipate market moves. By focusing on key elements such as trend lines, trading volume, and the overall structure of the wedge pattern, traders can enhance their ability to identify and act on high-quality crypto trading setups.
Understanding the Falling Wedge Pattern
The falling wedge is a powerful chart formation that develops when price creates lower highs and lower lows within a narrowing channel. This pattern is defined by two trend lines, or two converging lines, with the upper resistance line and the lower support line sloping downward toward each other. The trend line connecting the highs forms the upper resistance, while the lower trend line connects the lows, creating a cone or wedge shape that narrows as the pattern progresses. As the pattern matures, the lower support line converge with the upper resistance line, further tightening the price action.
At its core, the falling wedge represents a gradual shift in market psychology. Initially, sellers control the market, pushing prices lower. However, as the pattern develops, selling pressure begins to diminish while buying interest gradually increases. As the wedge matures, new buying interest often emerges, with buyers using the consolidation phase to reorganize and drive the asset's price higher. This battle between bears and bulls manifests as a compression in price volatility, with the narrowing distance between trend lines revealing waning downside momentum. For those using crypto trading bots, this compression phase can trigger real-time alerts or even initiate pre-configured trades, depending on the level of automation deployed.
For a valid falling wedge to form, there must be at least two reaction highs to establish the upper resistance line and two reaction lows to form the lower support line. As price approaches the apex (where the two lines would eventually meet), the pattern typically resolves with a breakout through the upper trendline, which acts as the key resistance level to watch. This breakout often leads the price to trend higher, signaling a potential trend reversal or continuation.
Trading volume plays a crucial role in validating the pattern. During formation, volume generally decreases as the wedge develops, indicating diminishing seller conviction. When the breakout occurs, volume should increase significantly, confirming renewed buyer interest and strengthening the reliability of the signal.
The falling wedge can function in two distinct market contexts. As a reversal pattern, it forms during a downtrend and signals a potential change in direction to an uptrend. Less commonly, it can appear as a continuation pattern during an established uptrend, representing a temporary pullback before the original uptrend resumes. In both scenarios, the pattern maintains its bullish implications, with price expected to break upward.
When trading the falling wedge, timing is essential. Entering too early within the pattern risks getting caught in continued downward price action, while waiting too long after the breakout may mean missing significant upside. Most experienced traders look for confirmation of the breakout before entering, which includes increased volume and a decisive move above the upper trendline.
The typical duration of a falling wedge varies by market and timeframe, but on daily charts, these patterns often develop over three to six months. The pattern should ideally form after a significant downtrend and over a period of several months for maximum reliability. Longer-term patterns on weekly charts generally have more significance and reliability than shorter-term formations.
Key Characteristics and How to Identify the Pattern
-
Converging Downward Trend Lines - Both the upper resistance line and lower support line slope downward, with the upper line descending at a steeper angle. This convergence is critical—it distinguishes the falling wedge price chart pattern from a descending channel, which has parallel trend lines. As a technical formation, the falling wedge is recognized by its narrowing structure.
-
Lower Highs and Lower Lows - Price creates a series of lower highs and lower lows, maintaining the appearance of a downtrend while actually compressing into the wedge formation. You need at least two reaction highs and two reaction lows to draw the pattern’s boundaries accurately.
-
Decreasing Volume During Formation - As the pattern develops, trading volume typically diminishes. This declining volume indicates consolidation and weakening seller conviction—a key sign that downward momentum is fading.
-
Increased Volume at Breakout - When price breaks through the upper resistance line, volume should increase significantly. This volume surge confirms buyer conviction and improves the reliability of the breakout signal.
-
Prior Downtrend - For a falling wedge to function as a reversal pattern, there should be an established downtrend preceding the pattern. The more significant and extended this downtrend, the more powerful the potential reversal signal. Always consider the prevailing trend before the pattern forms to assess its significance.
-
Duration - The pattern typically forms over weeks to months, with longer durations generally producing more reliable signals. Patterns that develop too quickly may not represent true shifts in market psychology.
-
Depth - The vertical distance from the highest point to the lowest point in the pattern should be significant enough to indicate a genuine market movement rather than just market noise.
To identify a falling wedge on a chart, follow these steps:
-
Locate a security in a downtrend or a corrective phase within an uptrend. Evaluate the current trend and prevailing trend to determine whether the pattern is likely to signal a reversal or continuation.
-
Identify at least two reaction highs that can be connected with a downward-sloping line (upper resistance).
-
Identify at least two reaction lows that can be connected with a downward-sloping line (lower support).
-
Verify that both lines are converging, with the upper line having a steeper downward slope.
-
Check that volume decreases as the pattern progresses, confirming consolidation.
-
Watch for a breakout above the upper resistance line, preferably with increased volume.
-
Confirm the breakout with a close above the resistance line and sustained movement in that direction.
When scanning for this pattern, be patient and avoid forcing trendlines to fit your expectations. A genuine falling wedge will be visually apparent with clearly defined boundaries and the characteristic narrowing shape. The pattern suggests a potential reversal or continuation, depending on its context within the broader trend.
Reversal vs Continuation: When Does the Pattern Apply?
As a Reversal Pattern:
The falling wedge most commonly functions as a reversal pattern, forming at the end of a downtrend and signaling a potential shift to an uptrend. In this context, the pattern represents the final stage of selling pressure before buyers regain control. Often, the falling wedge marks the final low of a prolonged downtrend, indicating a critical reversal point before the market begins to move upward.
For a reversal falling wedge to be valid, look for these characteristics:
-
Formation after an extended downtrend (ideally lasting several months)
-
Clear evidence of selling exhaustion (decreasing volume on downward movements)
-
Bullish divergence on momentum indicators like RSI (price makes lower lows while RSI makes higher lows)
-
Decreasing volatility as the pattern develops, indicating consolidation
-
A decisive breakout above the upper resistance line with increased volume
Reversal falling wedges often form after a “climax trough” or panic selling event, where the market experiences a sharp decline followed by a period of consolidation. The pattern signals that selling pressure has been largely exhausted and buyers are gradually becoming more aggressive.
As a Continuation Pattern:
Less frequently, the falling wedge appears as a continuation pattern during an established uptrend. In this scenario, it represents a temporary pullback or consolidation before the original uptrend resumes. When a descending wedge develops during an uptrend, it acts as a continuation signal, suggesting that the price will likely resume its upward movement after the breakout.
For a continuation falling wedge to be valid, look for these characteristics:
-
Formation during an established uptrend
-
Development as a corrective phase after a strong upward move
-
Relatively shorter duration compared to reversal wedges
-
Price remaining above major support levels despite the pullback
-
Overall market or sector strength during the pattern formation
Continuation falling wedges often form when profit-taking or temporary uncertainty causes a pullback in a strong uptrend. Once this consolidation resolves with a breakout, the prior uptrend typically resumes with renewed momentum.
The key difference between these two applications lies in market context. To determine which scenario applies, evaluate:
-
Prior Trend Direction - Is the security in a broader downtrend (suggesting a reversal pattern) or uptrend (suggesting a continuation pattern)?
-
Pattern Location - Does the pattern form after an extended decline or during a pullback in an uptrend?
-
Pattern Duration - Reversal patterns typically take longer to form than continuation patterns.
-
Broader Market Conditions - The overall market direction can influence whether a pattern acts as a reversal or continuation.
Regardless of whether the falling wedge functions as a reversal or continuation pattern, the trading approach remains similar: wait for confirmation of the breakout above the upper resistance line before entering a long position. When the asset's price left the wedge to the upside, it confirms the end of the consolidation or correction phase and signals a potential bullish move.
Comparing Falling Wedge with Similar Patterns
| Pattern | Key Characteristics | Directional Bias | Main Differences from Falling Wedge |
|---|---|---|---|
| Falling Wedge | Two converging downward-sloping lines with upper line steeper than lower line | Bullish | N/A (reference pattern) |
| Symmetrical Triangle | Converging lines with upper line sloping down and lower line sloping up | Neutral (breaks in either direction) | Both lines converge at equal angles; lower line slopes upward rather than downward |
| Descending Triangle | Horizontal lower support line with downward-sloping upper resistance line | Bearish | Flat lower support line rather than downward-sloping; typically breaks downward |
| Pennant | Small symmetrical triangle after a sharp price movement ("flagpole") | Continuation of prior trend | Forms over shorter timeframe; requires preceding sharp movement; represents brief consolidation |
| Descending Channel | Parallel downward-sloping lines connecting lower highs and lower lows | Bearish | Parallel lines rather than converging; consistent rather than diminishing downward momentum |
| Rising Wedge | Two converging upward-sloping lines with lower line steeper than upper line | Bearish | Mirror image of falling wedge; sloping upward rather than downward; bearish rather than bullish bias |
Visual distinctions between these patterns can be subtle but crucial for accurate identification. When differentiating a falling wedge from similar patterns, focus on these key points:
Falling Wedge vs. Symmetrical Triangle: In a falling wedge, both boundary lines slope downward, whereas in a symmetrical triangle, the lower boundary slopes upward. Additionally, the falling wedge has a bullish bias, while the symmetrical triangle is direction-neutral until breakout.
Falling Wedge vs. Descending Triangle: The descending triangle has a horizontal lower support line, unlike the falling wedge's downward-sloping lower boundary. Descending triangles typically break downward, while falling wedges usually break upward.
Falling Wedge vs. Pennant: Pennants form quickly after sharp price movements and represent brief consolidations before trend continuation. Falling wedges develop more gradually and can signal either reversal or continuation depending on context.
Falling Wedge vs. Descending Channel: In a descending channel, the boundary lines remain parallel rather than converging, indicating consistent rather than diminishing selling pressure. While both move downward, the channel lacks the compression that signals potential reversal in a wedge.
Falling Wedge vs. Rising Wedge: These are mirror images with opposite implications. The rising wedge slopes upward with converging boundaries and typically breaks downward (bearish), while the falling wedge slopes downward and typically breaks upward (bullish).
Accurate pattern identification requires practice and attention to detail. Common misidentification errors include mistaking a descending channel for a falling wedge or confusing a symmetrical triangle with a poorly formed wedge. Always verify the slope and convergence of the boundary lines before concluding that you've identified a falling wedge.
How Reliable Is the Falling Wedge Pattern?
The falling wedge is generally considered a reliable bullish pattern, but its success rate varies depending on several factors. While exact statistics differ across studies and market conditions, well-formed falling wedges that meet all the criteria typically have a higher probability of producing successful trades than many other patterns.
The reliability of a falling wedge depends significantly on the quality of its formation and the context in which it appears. Several factors influence its predictive accuracy:
-
Pattern Quality - Well-defined wedges with clear boundaries that connect multiple reaction points tend to be more reliable than poorly formed patterns.
-
Volume Confirmation - Patterns with the characteristic volume profile (decreasing during formation, increasing at breakout) have higher reliability than those lacking volume confirmation.
-
Timeframe - Falling wedges on higher timeframes (daily, weekly) generally have more significance and reliability than those on lower timeframes (hourly, 15-minute).
-
Market Context - The pattern tends to be more reliable when it aligns with the broader market direction or forms at key support levels.
-
Breakout Confirmation - Waiting for confirmation signals such as a decisive close above the resistance line and increased volume significantly improves success rates.
-
Market Type - The pattern may show different reliability levels across various markets (stocks, forex, crypto) depending on liquidity and participant behavior.
When compared to other chart patterns, the falling wedge often ranks favorably in terms of reliability. Its clearly defined structure and the psychological market dynamics it represents contribute to its predictive value. However, like all technical patterns, it isn’t infallible and should be used as part of a comprehensive trading strategy rather than in isolation. Incorporating the falling wedge into systematic trading strategies can help traders make more informed trading decisions by combining the pattern with other indicators and risk management techniques.
Best practices for maximizing success with falling wedge patterns include:
-
Wait for a confirmed breakout rather than anticipating it
-
Verify volume patterns align with expectations
-
Combine with other technical indicators for confirmation
-
Consider the broader market context and trend
-
Use appropriate risk management with clearly defined stop-losses
-
Focus on quality patterns rather than forcing identifications
-
Be patient—the most reliable patterns often take time to develop
-
Practice identifying the pattern across different securities and timeframes
When planning exits and profit-taking, traders often set price targets after a breakout by projecting the height of the wedge from the breakout point. Setting a target price based on previous support or resistance levels can help maximize gains and guide profit-taking strategies.
Even the most reliable patterns can fail, particularly if external factors (such as unexpected news or broad market shifts) intervene. Therefore, proper risk management remains essential regardless of a pattern’s historical reliability.
The Role of Volume in Pattern Formation & Breakout
Volume provides critical confirmation for the falling wedge pattern, serving as a window into market psychology and participant conviction. Understanding and correctly interpreting volume behavior significantly enhances the pattern's reliability as a trading signal.
During the formation phase of a falling wedge, volume typically decreases as the pattern progresses. This declining volume reflects diminishing seller enthusiasm and a gradual transition from active selling to consolidation. Think of it as the bears running out of steam—fewer shares or contracts change hands as the downward movement loses momentum and participants await clearer direction.
This volume contraction is not merely coincidental—it's a fundamental component of what makes the falling wedge a valid pattern. The combination of converging price boundaries and decreasing volume represents a compression of both price movement and trading activity, signaling that a significant move may be imminent as this tension eventually resolves.
The breakout phase is where volume becomes particularly crucial. When price finally breaks through the upper resistance line of the wedge, there should be a noticeable increase in trading volume. This volume surge indicates that buyers are entering with conviction, providing the necessary momentum to sustain the new upward movement. Without this volume confirmation, the breakout may lack staying power and potentially fail.
Traders should look for volume that is at least 50% above the average of recent sessions during the breakout day or period. This significant increase serves as validation that the pattern completion isn't merely a technical move but reflects genuine buying interest from market participants.
False breakouts (often called "bull traps" in this context) frequently occur with light volume. When price briefly moves above the resistance line but volume remains flat or even decreases, the breakout lacks conviction and may quickly reverse. These false signals are one reason why volume analysis is indispensable when trading falling wedge patterns.
In some cases, volume may show interesting divergences that provide additional insights. For example, if volume increases on upward price movements within the wedge while decreasing on downward movements, it suggests accumulation occurring before the formal breakout—a potentially very bullish sign.
Trading the falling wedge without attention to volume is like navigating without a compass—possible but considerably riskier. By incorporating volume analysis into your pattern recognition process, you gain a deeper understanding of the market forces at work and substantially improve your chances of successful trades.
Entry, Stop-Loss & Take-Profit Strategies
Effective trading of the falling wedge pattern requires thoughtful approaches to entry timing, risk management through stop-loss placement, and profit-taking strategies. Here are comprehensive tactics for each component:
Entry Strategies:
-
Breakout Entry - Enter when price breaks and closes above the upper resistance line of the wedge, typically with confirmation from increased volume. This is the most conservative and widely used approach.
-
Pullback Entry - After a confirmed breakout, wait for price to retrace and test the broken resistance line (which should now act as support) before entering. This often provides a better entry price but risks missing the trade if the pullback doesn’t occur.
-
Anticipatory Entry - Enter near the apex of the wedge before the breakout when additional confirming signals are present (such as bullish divergence on momentum indicators or positive changes in volume patterns). This higher-risk approach can offer better risk-reward ratios but increases the chance of being caught in a failed pattern.
-
Scaled Entry - Divide your intended position size into portions, entering partially at the breakout and adding during confirmation or pullbacks. This balances the risks of missing the move versus entering a false breakout.
Stop-Loss Strategies:
-
Below Support Line - Place stop-loss slightly below the lower support line of the wedge. This approach respects the pattern’s structure but may result in larger potential losses.
-
Below Recent Low - Position stop-loss just below the most recent significant low within the pattern, offering a tighter stop while still respecting the price structure.
-
Percentage or ATR-Based - Set stop-loss based on a predetermined percentage of your entry price or using Average True Range (ATR) multipliers (such as 2-3 ATR units below entry). This approach adapts to the specific volatility of the security.
-
Below Breakout Level - After a confirmed breakout, place stop-loss just below the breakout point or below the upper trend line. This technique minimizes risk while still allowing for normal market fluctuations.
Take-Profit Strategies:
-
Measured Move - Project the height of the wedge at its widest point (beginning) upward from the breakout point. This classic approach derives a price target directly from the pattern’s dimensions and helps set a clear target price for profit-taking.
-
Previous Resistance Levels - Identify key resistance levels from before the wedge formation, especially previous highs, to establish logical profit targets, as price often reacts to these historical levels.
-
Fibonacci Extensions - Use Fibonacci extension levels (127.2%, 161.8%, or 261.8%) projected from the wedge’s low point to set potential targets, particularly effective in trending markets.
-
Trailing Stops - Instead of a fixed target, implement a trailing stop that moves up as price advances (such as below a 20-period moving average or using ATR-based trailing). This approach allows for capturing extended moves while protecting profits.
-
Partial Profit-Taking - Scale out of positions by taking partial profits at different levels: perhaps 1/3 at the measured move price target, 1/3 at a Fibonacci extension, and letting the final 1/3 run with a trailing stop.
-
After a breakout, a strong price rally can occur, often exceeding initial target estimates and providing additional profit opportunities.
Risk Management Considerations:
-
Limit position size to risk only 1-2% of trading capital on any single falling wedge trade
-
Calculate position size based on the distance to your stop-loss, not on a fixed dollar amount or percentage of capital
-
Consider risk-reward ratios of at least 2:1 (preferably 3:1 or higher) before taking a trade
-
Be willing to pass on setups that don’t offer favorable risk-reward profiles
-
Maintain a trading journal that tracks falling wedge performance to refine your approach over time
The most successful traders adapt these strategies to specific market conditions, the quality of the pattern, and their individual risk tolerance. There is no universal “best” approach—the optimal strategy combines these elements in a way that aligns with your trading style and objectives.
Common Mistakes to Avoid
-
Misidentifying Similar Patterns - Confusing falling wedges with descending channels, symmetrical triangles, or other formations leads to incorrect trading expectations. Always verify that both boundary lines slope downward and converge, with the upper line having a steeper angle than the lower line. Remember: in a falling wedge, the rate of decline of the highs exceeds the rate of decline of the lows.
-
Ignoring Volume Confirmation - Many traders focus exclusively on price action, neglecting the crucial role of volume. A genuine falling wedge typically shows decreasing volume during formation and increased volume at breakout. Trading patterns without this volume confirmation significantly increases the risk of acting on false signals.
-
Entering Prematurely - Impatience leads to entering positions before proper confirmation, often resulting in unnecessary losses. Wait for a decisive break and close above the upper resistance line, preferably with volume confirmation, rather than anticipating the breakout based on pattern recognition alone.
-
Chasing Late Breakouts - The opposite error involves entering too late, after a substantial move has already occurred. Establish criteria for what constitutes a "missed" opportunity and be willing to look for other setups rather than chasing extended moves with unfavorable risk-reward profiles.
-
Setting Improper Stop-Losses - Placing stops too tight results in being shaken out of potentially profitable trades, while stops that are too loose expose you to unnecessary risk. Base stop placement on the pattern's structure (below support or a recent significant low) or volatility measures like ATR rather than arbitrary distances.
-
Having Unrealistic Profit Expectations - While falling wedges can lead to significant moves, expecting extraordinary gains from every pattern creates disappointment and poor decision-making. Use measured moves and other objective methods to establish realistic targets rather than hoping for outsized returns.
-
Neglecting the Broader Market Context - Trading the pattern in isolation without considering the overall market environment, sector performance, or related securities can lead to poor outcomes. A falling wedge that forms against a strongly bearish broader market may be less reliable than one that aligns with general market strength.
-
Overtrading the Pattern - Seeing falling wedges everywhere after learning about the pattern leads to forcing identifications on ambiguous price action. Quality matters more than quantity—focus on well-formed patterns with clear boundaries rather than marginal formations.
-
Failing to Consider Timeframe Differences - The significance of a falling wedge varies considerably across timeframes. A pattern on a 5-minute chart has different implications than one on a daily or weekly chart. Higher timeframe patterns generally have more significance and reliability.
-
Disregarding False Breakout Possibilities - Even well-formed patterns can experience false breakouts. Failing to plan for this possibility or to use confirmation techniques (volume, momentum indicators, etc.) increases vulnerability to these deceptive moves.
To avoid these mistakes, develop a systematic approach to pattern identification and trading. Create a checklist that includes verification of pattern characteristics, volume confirmation, broader market context, and appropriate risk management measures. Review trades regularly, especially unsuccessful ones, to identify which common errors might be affecting your results.
Remember that even experienced traders occasionally fall victim to these pitfalls. The goal isn't perfect avoidance but continuous improvement through awareness and deliberate practice. By understanding these common mistakes, you can significantly improve your success rate when trading falling wedge patterns.
Market-Specific Considerations: Stocks, Forex, and Crypto
The falling wedge pattern appears across all major markets, but its behavior, reliability, and trading approach require adaptations based on the specific characteristics of each market environment.
Stock Market Considerations
-
Gap Influence - Stocks can gap up or down between trading sessions, potentially jumping over key pattern levels. Morning gaps above resistance can confirm breakouts but may offer less favorable entry prices.
-
Volume Significance - Volume data in stocks is particularly reliable and significant. Institutional participation is clearly reflected in volume, making volume confirmation especially important for stock market falling wedges.
-
Sector Correlation - Stocks often move in correlation with their sectors. A falling wedge in an individual stock may be more reliable if the sector is also showing strength or reversal signals.
-
Earnings Impact - Quarterly earnings announcements can dramatically affect pattern development. Avoid trading falling wedges immediately before earnings releases, as these events can invalidate technical patterns regardless of quality.
-
Market Hours Limitation - With defined trading hours, stock market patterns develop differently than in 24-hour markets. Most significant breakouts occur during regular trading hours with higher volume.
Forex Market Considerations
-
24-Hour Trading - The continuous nature of forex trading means patterns develop more fluidly without gaps (except weekends). This affects how breakouts form and how they should be confirmed.
-
Liquidity Variations - Major pairs (EUR/USD, USD/JPY) show more reliable pattern behavior than exotic pairs due to higher liquidity. Falling wedges in exotic pairs require additional confirmation due to higher volatility and potential manipulation.
-
Session Importance - The most reliable breakouts often occur during London or New York sessions when liquidity and participation are highest. Asian session breakouts may lack follow-through.
-
Economic Releases - Currency pairs are highly sensitive to economic data and central bank announcements. These events can trigger breakouts or invalidate patterns regardless of technical structure.
-
Correlation Considerations - Currency pairs have complex correlations. A falling wedge in EUR/USD may be affected by movements in related pairs like GBP/USD or USD/CHF.
Cryptocurrency Market Considerations
-
Extreme Volatility - Cryptocurrencies experience significantly higher volatility than traditional markets. This requires wider stops when trading falling wedges and influences appropriate position sizing.
-
24/7 Trading - Like forex but without weekend closures, crypto markets trade continuously. This affects pattern development and means significant moves can happen at any time, including nights and weekends.
-
Volume Distribution - Trading volume in crypto is spread across numerous exchanges, making consolidated volume analysis more challenging but still essential.
-
Market Maturity - As relatively young markets, cryptocurrencies sometimes display more "textbook" technical patterns due to the significant role of retail traders and technical analysis in these markets.
-
Regulatory Sensitivity - Crypto markets react strongly to regulatory news, which can override technical patterns regardless of quality. Be aware of pending regulatory decisions when trading crypto falling wedges.
-
Bitcoin Dominance - Altcoins are heavily influenced by Bitcoin's movements. A falling wedge in an altcoin may fail if Bitcoin moves strongly in the opposite direction, regardless of the pattern's quality.
Cross-Market Trading Approaches
Despite these differences, several principles apply across all markets:
-
Higher Timeframe Priority - In all markets, falling wedges on higher timeframes (daily, weekly) have more significance than those on lower timeframes.
-
Liquidity Consideration - Focus on the most liquid instruments within each market category. Blue-chip stocks, major forex pairs, and top cryptocurrencies by market cap tend to display more reliable pattern behavior.
-
Confluence Approach - Look for additional confirming factors regardless of market type. The most reliable setups occur when multiple factors align (pattern completion, support/resistance levels, indicator signals).
-
Risk Adjustment - Adjust position sizing based on the inherent volatility of each market. The same falling wedge pattern might warrant a smaller position in crypto than in a blue-chip stock due to volatility differences.
By understanding these market-specific nuances, you can adapt your falling wedge trading approach to maximize effectiveness across different trading environments while maintaining a consistent overall strategy.
Combining the Falling Wedge with Other Technical Indicators
The falling wedge pattern becomes significantly more powerful when combined with complementary technical indicators that confirm its signals and filter out potential false breakouts. Strategic indicator combinations create a more robust trading system that capitalizes on the pattern's strengths while addressing its limitations.
Momentum Indicators
Relative Strength Index (RSI)
The RSI provides valuable confirmation for falling wedge patterns, particularly through divergence. Look for bullish divergence—where price makes lower lows while RSI makes higher lows—during the formation of the wedge. This divergence suggests weakening downside momentum despite continuing price declines, supporting the bullish case. Additionally, when RSI crosses above the 50 level coinciding with a falling wedge breakout, it provides strong confirmation of a shift from bearish to bullish momentum.
Moving Average Convergence Divergence (MACD)
MACD histogram increasing in value or the MACD line crossing above its signal line near the breakout point confirms positive momentum. The most powerful signals occur when the MACD shows bullish divergence during wedge formation (lower price lows but higher MACD lows) and then confirms with a signal line crossover as price breaks above resistance. This combination significantly reduces false breakout risk.
Stochastic Oscillator
The stochastic oscillator can identify oversold conditions within the falling wedge and signal potential reversals. When stochastic lines cross upward from below 20 (oversold territory) while price remains within the wedge, it suggests building bullish momentum. The most reliable setups occur when this crossover precedes the price breakout, essentially foreshadowing the coming reversal.
Moving Averages
Moving Average Crossovers
Combining falling wedge breakouts with moving average crossovers creates powerful confirmation. For example, when a shorter-term moving average (e.g., 20-period) crosses above a longer-term moving average (e.g., 50-period) near the breakout point, it provides technical validation of the trend change. This approach works particularly well when the crossover occurs shortly after the price breaks above wedge resistance.
Moving Average Convergence
As a falling wedge develops, watch for flattening or converging moving averages. When previously declining moving averages begin to flatten and narrow their spread near the wedge apex, it suggests diminishing downside momentum. If these moving averages then begin turning upward as price breaks above wedge resistance, the confirmation is especially strong.
Price and Moving Average Relationships
Monitor price position relative to key moving averages. A falling wedge breakout that simultaneously pushes price above significant moving averages (such as the 50-day or 200-day MA) carries additional significance. The moving average then often becomes support during subsequent pullbacks, offering potential entry opportunities.
Volume Indicators
On-Balance Volume (OBV)
OBV can reveal underlying buying pressure before it becomes apparent in price. Look for bullish divergence where OBV trends upward while price continues making lower lows within the wedge. This suggests accumulation occurring despite declining prices—a powerful leading indicator. When OBV confirms a breakout by surging upward as price breaks resistance, the signal becomes particularly reliable.
Volume Moving Averages
Compare breakout volume to recent average volume. A breakout on volume that exceeds the 20-day volume moving average by 50% or more indicates strong participation and conviction in the new direction. This simple but effective approach helps distinguish between genuine breakouts and false moves.
Volume Profile
Volume profile analysis can identify key support/resistance levels based on historical trading activity. When a falling wedge breakout coincides with price moving above a significant volume node or "low volume zone," it suggests less resistance to further upward movement, increasing the probability of a sustained move.
Support/Resistance and Price Action Tools
Fibonacci Retracement Levels
Falling wedges often form near key Fibonacci retracement levels of previous uptrends. When a wedge forms after a 50% or 61.8% retracement and then breaks upward, it creates a high-probability setup. The Fibonacci levels provide additional context for the pattern and help identify potential targets using Fibonacci extensions.
Candlestick Patterns
Bullish candlestick patterns forming near support or during breakout provide additional confirmation. Patterns like bullish engulfing, morning star, or hammer formations occurring at the lower boundary of the wedge or during the breakout significantly enhance the signal quality.
Horizontal Support/Resistance
When a falling wedge forms at or breaks through significant horizontal support/resistance levels, it gains additional technical significance. These key levels can also help identify potential targets for the subsequent move.
Practical Integration Strategies
To effectively combine these indicators with falling wedge patterns, consider these approaches:
-
Multi-Confirmation System: Require the primary pattern plus confirmation from at least two categories of indicators (e.g., momentum, volume, moving averages) before entering trades
-
Tiered Entry Approach: Enter a partial position on the initial pattern breakout and add to the position as additional indicators confirm
-
Indicator Convergence: Look for multiple indicators signaling simultaneously as the wedge approaches its apex
-
Timeframe Alignment: Confirm signals across multiple timeframes for increased reliability
-
Adaptive Indicator Selection: Adjust which confirmations you require based on market conditions and the specific security being traded
The most effective approach isn't using as many indicators as possible, but rather thoughtfully selecting complementary tools that address specific aspects of confirmation. Focus on creating a balanced system that validates pattern quality, momentum, volume dynamics, and broader market context without redundancy or overcomplication.
Conclusion
The falling wedge pattern stands as one of technical analysis's most valuable formations, offering traders a structured approach to identifying potential bullish reversals and continuation opportunities. By recognizing its distinctive converging downward trend lines, volume characteristics, and breakout dynamics, you gain insight into the critical psychological shift from selling pressure to buying interest that drives market reversals.
As we've explored, successful trading of this pattern requires more than simple identification. Understanding the differences between reversal and continuation contexts, distinguishing the falling wedge from similar patterns, applying appropriate entry and exit strategies, and avoiding common pitfalls all contribute to improved trading outcomes. The pattern's reliability, while generally strong, is significantly enhanced when traders incorporate volume analysis and complementary technical indicators.
Market-specific considerations remind us that while the core principles remain consistent, adaptations for stocks, forex, and cryptocurrencies help optimize the pattern's application across different trading environments. In all markets, the most powerful signals occur when the falling wedge is confirmed by multiple factors, including volume expansion on breakouts, momentum indicator convergence, and alignment with broader market trends.
Remember that even the most well-formed patterns occasionally fail, making proper risk management an essential component of any falling wedge trading strategy. By setting appropriate stop-losses, managing position sizes relative to risk, and having realistic profit expectations, you can protect capital while capitalizing on the pattern's bullish potential.
Ultimately, the falling wedge pattern exemplifies what makes technical analysis valuable—it provides a visual representation of changing market psychology that, when properly interpreted, helps traders identify high-probability opportunities. By incorporating this pattern into your technical toolkit with a thoughtful, disciplined approach, you gain a powerful advantage in navigating the complex world of financial markets.