


If you have ever watched a crypto price drop sharply, thought "that looks like a buying opportunity," and then done nothing because you were not fast enough — this article is for you.
Mean reversion trading is the practice of entering when price has moved too far, too fast, and betting that it snaps back. It is one of the most reliable patterns in crypto markets. And with the Wunder DCA Strategy, you can automate it completely.
What Is Mean Reversion Trading?
Markets rarely move in a straight line. Prices overshoot — up and down — then correct back toward their average. Mean reversion strategies exploit this by:
- Buying after sharp drops (expecting a bounce)
- Selling after sharp spikes (expecting a pullback)
The challenge is timing. Not every dip bounces. Some drops are the beginning of a larger trend. The key is only trading when conditions are right — and that is exactly what this bot configuration does.
The Strategy at a Glance
This setup uses three components working together:
1. Price Change — the entry signal The bot monitors how much price has moved over the last 1–3 candles. When the move exceeds a threshold you set, it enters a trade in the opposite direction.
2. STD+Percentile Filter — the regime gate Before entering any trade, the bot checks whether market volatility is in the right zone. Too calm (no energy for a bounce) or too chaotic (unpredictable) — the bot sits out. Only when conditions are "just right" does it enter.
3. Trailing Stop + RSI Exit — the exit system Once in a trade, a trailing stop follows price upward (for longs), locking in profit automatically. An RSI exit acts as a backup, closing the trade if momentum indicators signal exhaustion.
No manual watching. No emotional decisions. The bot handles everything.
Full Setup for All Three Pairs
Step-by-Step Setup Guide
Step 1 — Core Settings
Open the Wunder DCA Strategy settings and start with the basics.
| Setting | Value |
|---|---|
| Trade direction | BOTH |
| Entry condition type | Price Change |
| Capital $ | Your allocated amount |
Setting trade direction to BOTH means the bot trades longs (buying dips) and shorts (selling spikes) automatically depending on which direction the move happens.
Step 2 — Configure the Price Change Signal
Navigate to the Price Change section of the inputs.
| Setting | What it does | Starting value |
|---|---|---|
| Price Change Period | How many candles to measure the move over | 2 |
| Price Cap % | Minimum move size required to trigger | 1.0% |
| Use RSI filter | Additional RSI confirmation (optional) | off |
How to think about Price Cap: too low (below 0.5%) and the bot triggers on routine noise. Too high (above 2%) and it misses most opportunities. Start at 1.0% and adjust based on your coin's typical daily range.
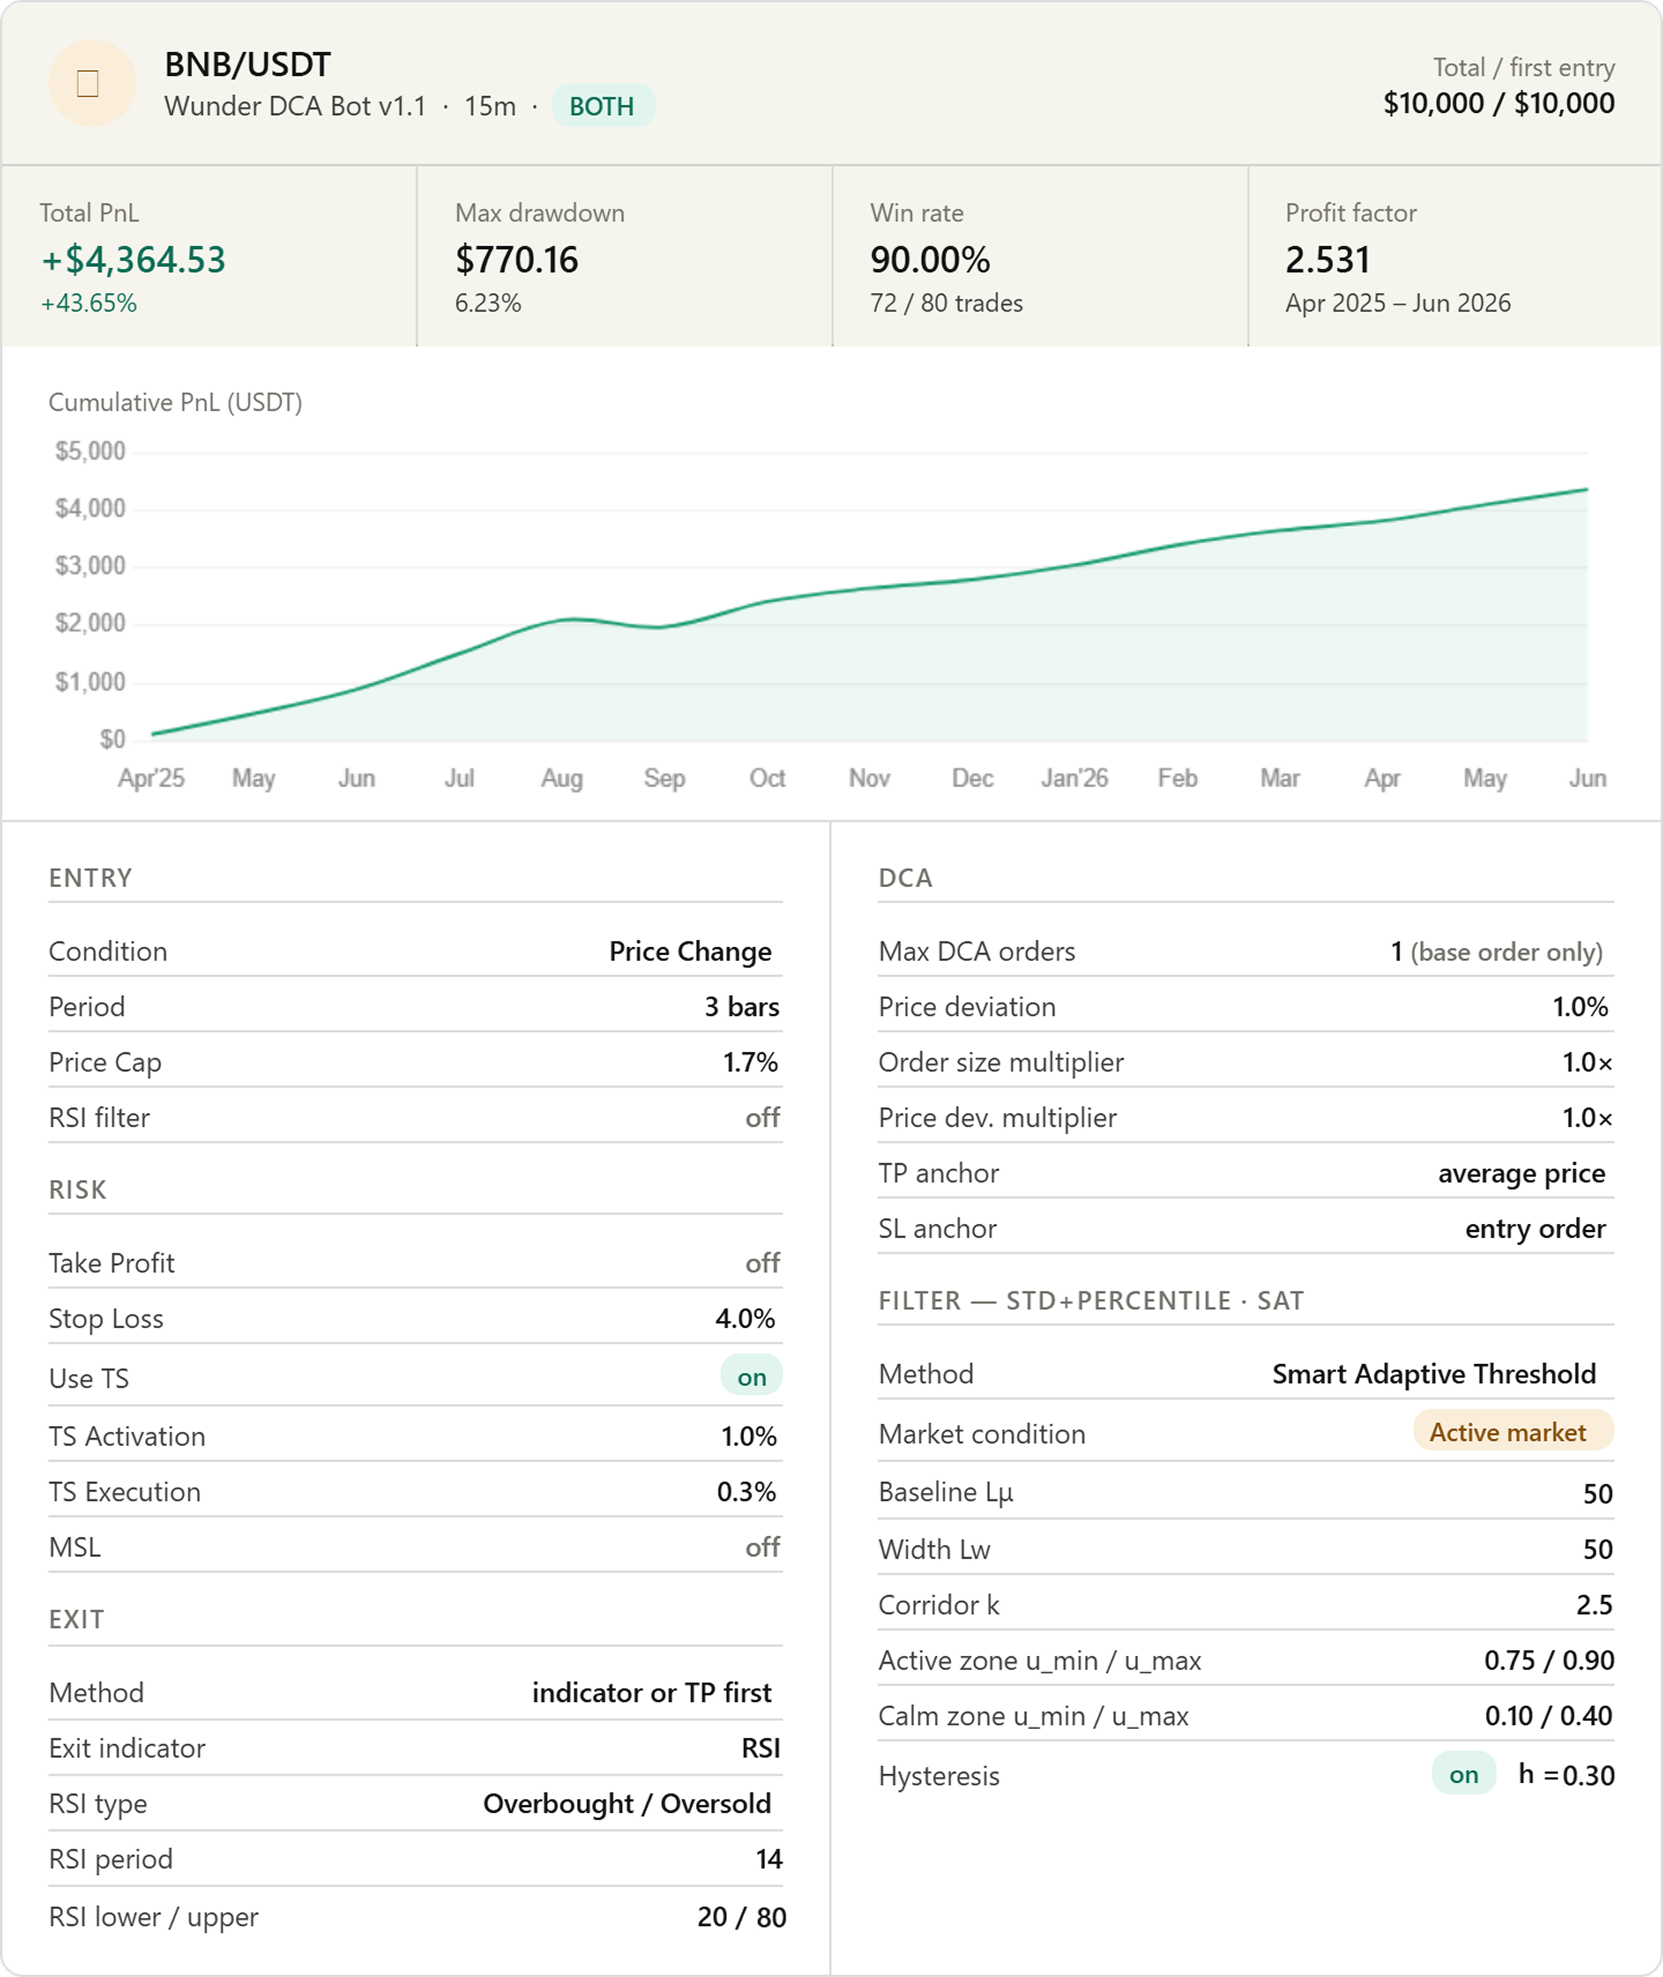
Pro tip: More volatile coins like HYPE can use a lower Price Cap (0.8%) because even small moves are meaningful. Calmer coins like BNB benefit from a higher threshold (1.7%) to filter out noise.
Step 3 — Set Up the STD+Percentile Filter
This is the most important step. Navigate to Trend Filter Settings.
| Setting | Value |
|---|---|
| Filter indicator type | STD+Percentile |
| STD+Percentile filter type | Smart Adaptive Threshold |
| Market condition | Active market |
Then configure the SAT parameters:
| Setting | Value | Why |
|---|---|---|
| SAT: Baseline SMA length (Lμ) | 60 | Defines the "normal" volatility level over ~15 hours on a 15m chart |
| SAT: Width SMA length (Lw) | 50 | Controls how wide the volatility corridor is |
| SAT: Corridor width multiplier (k) | 2.0 | Moderate corridor — not too strict, not too loose |
| SAT: Active zone floor (u_min) | 0.75 | Only enter when volatility is in the upper 75–90% of its corridor |
| SAT: Active zone ceiling (u_max) | 0.90 | Avoids extreme volatility spikes at the very top |
| SAT: Enable hysteresis | on | Prevents the filter from flickering when volatility sits on the boundary |
| SAT: Hysteresis margin (h) | 0.20 | Small stabilising buffer around the zone edges |
What this filter is doing in plain language: it only lets the bot trade when the market has enough energy to produce a real bounce — not in dead, flat conditions, and not in chaotic, unpredictable spikes. Think of it as a "conditions are right" check before every single trade.
Step 4 — Configure Risk Management
Navigate to Strategy Settings for stop loss and take profit.
| Setting | Recommended value |
|---|---|
| Use SL | on |
| Stop Loss % | 4.0–4.5% |
| Use TP | off (use trailing stop instead) |
Then set up the Trailing Stop:
| Setting | Value |
|---|---|
| Use TS | on |
| Trailing Stop Activation % | 1.0% |
| Trailing Stop Execution % | 0.3% |
Why trailing stop instead of fixed TP? A fixed take profit closes your trade at a predetermined level — say, 2% — even if price keeps moving in your favour. A trailing stop follows price upward and only closes when it reverses by the execution amount. This lets winning trades run further without letting them give back all their gains.
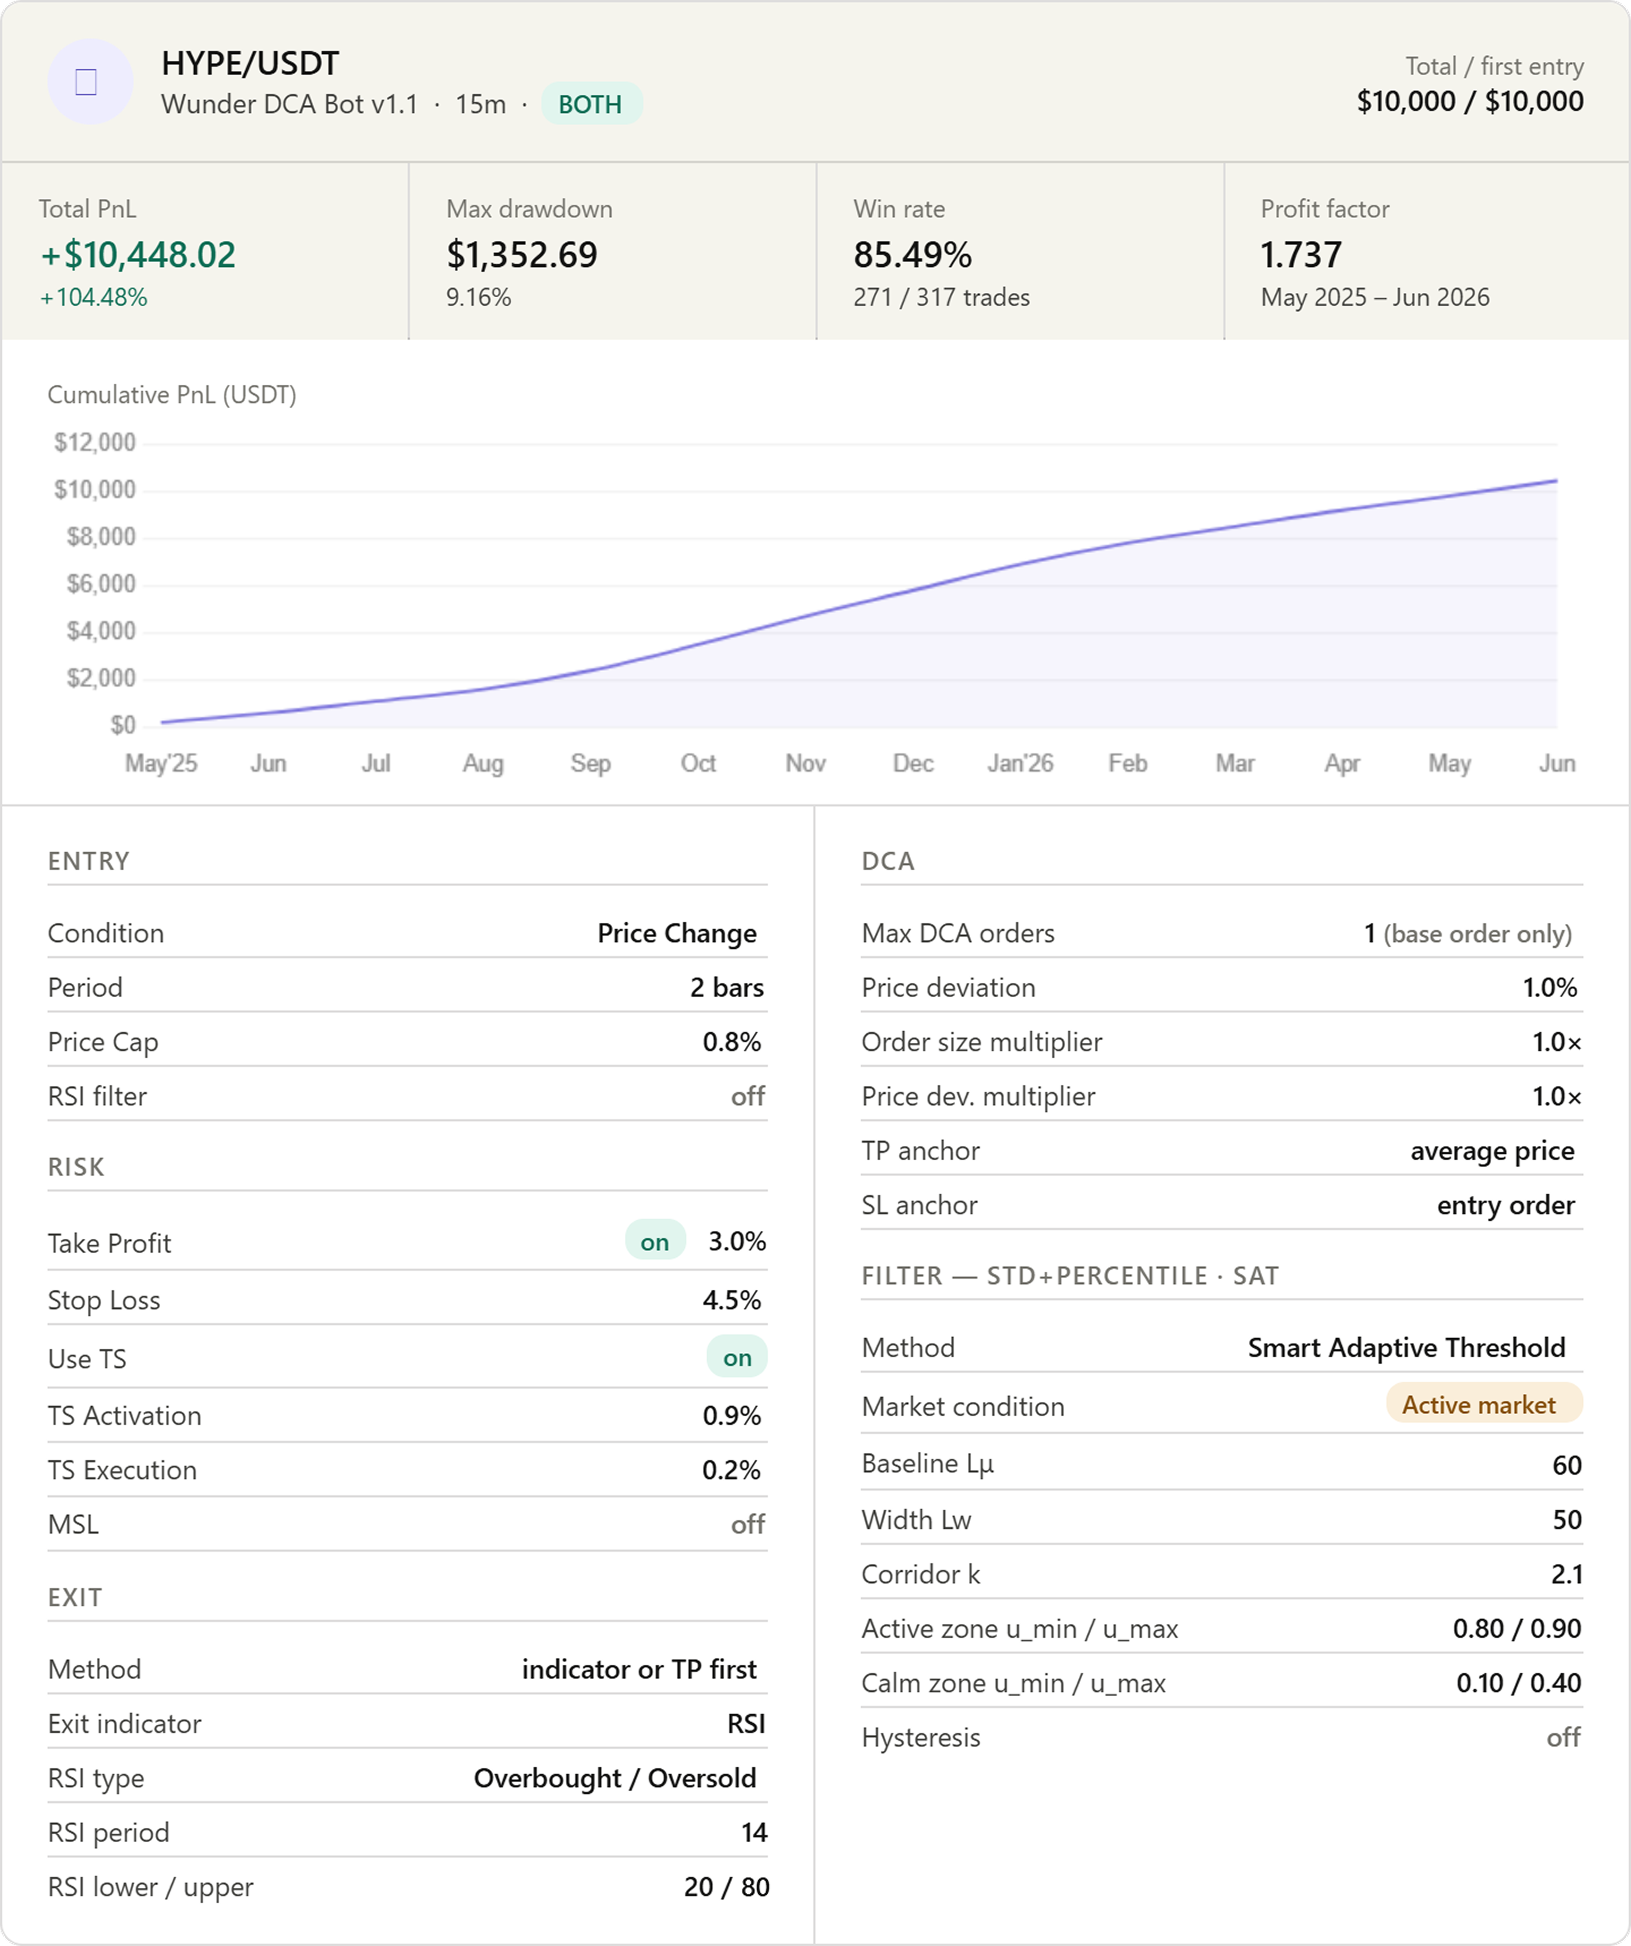
Exception: For highly volatile coins like HYPE, combining a fixed TP (3%) with the trailing stop works well. The fixed TP acts as a safety net to lock in profit before a sharp reversal can wipe it out.
Step 5 — Set Up the Exit Indicator
Navigate to Exit Settings.
| Setting | Value |
|---|---|
| Exit method | indicator or TP (First) |
| Exit indicator type | RSI |
| RSI exit type | Overbought/Oversold |
| RSI period | 14 |
| RSI lower limit | 20 |
| RSI upper limit | 80 |
This RSI exit closes the trade automatically if momentum reaches an extreme — RSI above 80 for a long trade, below 20 for a short. It acts as a second line of defence alongside the trailing stop, ensuring the bot does not hold a position while momentum is clearly exhausted.
Step 6 — (Optional) Add DCA Orders
DCA (Dollar Cost Averaging) places additional orders if price keeps moving against your initial entry, improving your average entry price.
Navigate to DCA Settings and configure:
| Setting | Value |
|---|---|
| Max DCA orders | 2 (1 base + 1 extra) |
| Price deviation | 2.0% |
| Order size multiplier | 1.0× |
| Price dev. multiplier | 1.0× |
| DCA TP anchor | average_price |
| DCA SL anchor | entry_order |
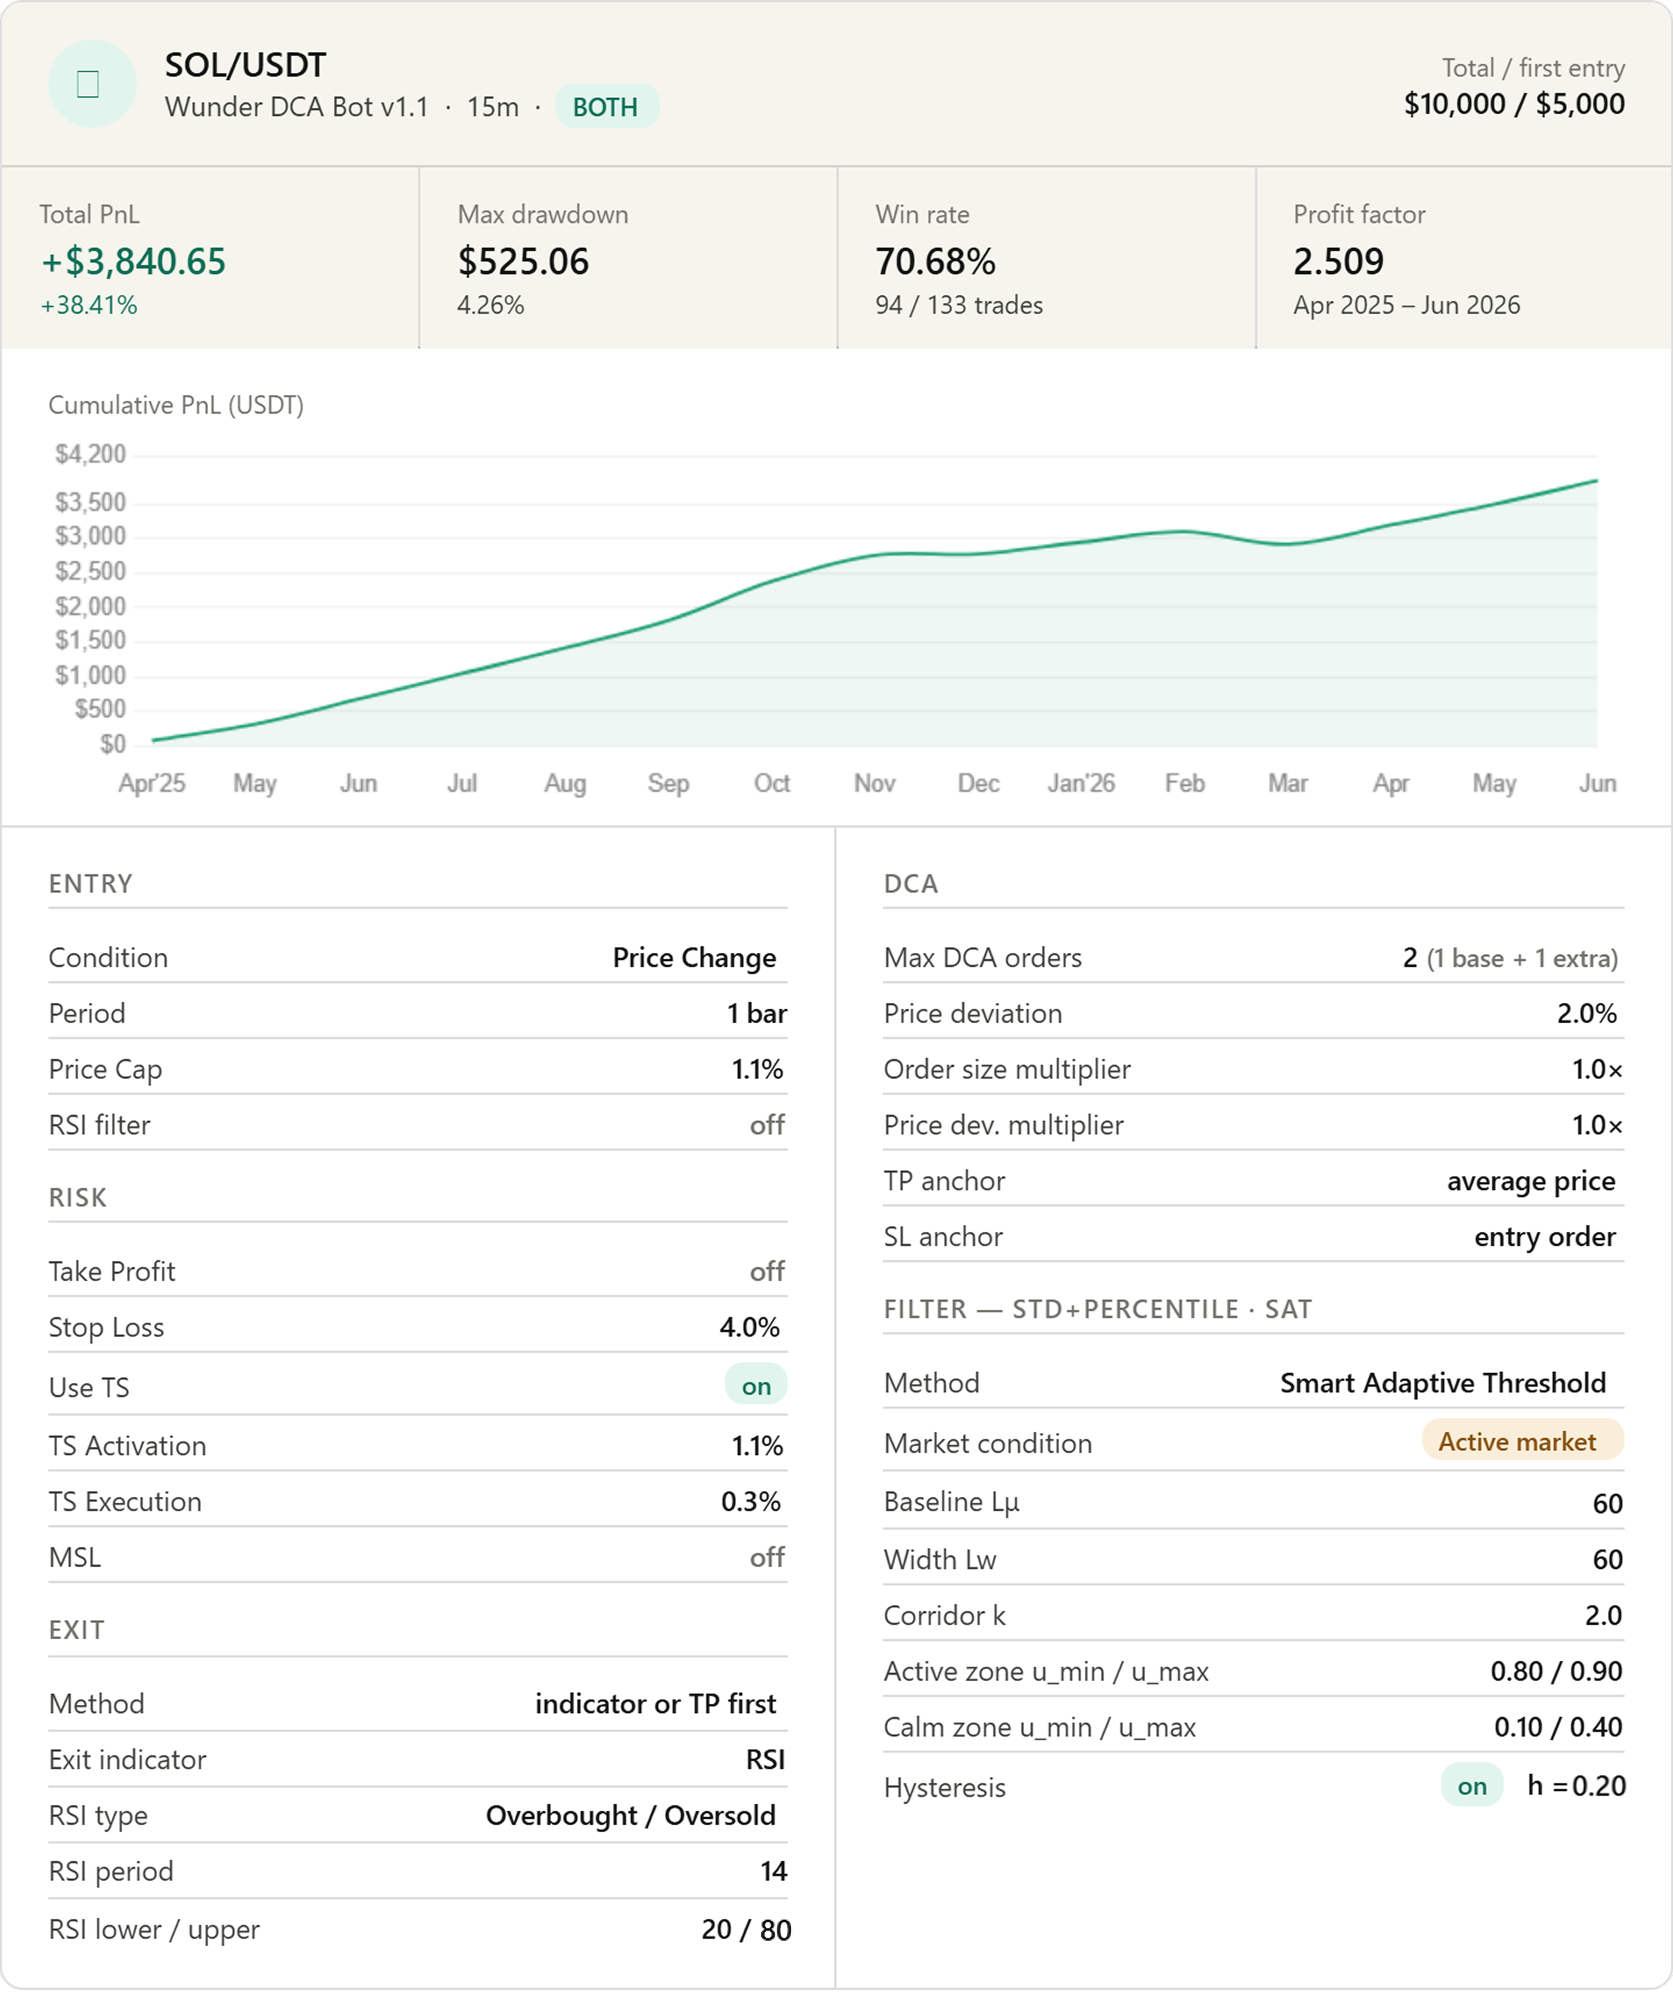
When to use DCA: it works best on liquid, well-established assets with consistent mean-reverting behaviour — like SOL or BNB. Avoid it on newer, more volatile assets until you have backtest data confirming the grid levels make sense.
Important: The stop loss must be wider than the entire DCA grid. If you see a red warning on the chart that says "The strategy has stopped trading," your stop loss is too tight. Increase the Stop Loss % or reduce the number of DCA orders.
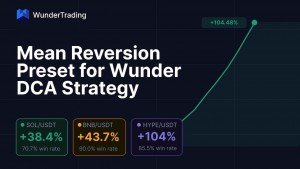
Real-World Results: Three Coins, Same Strategy
Here is what this configuration produced in backtesting across SOL/USDT, BNB/USDT, and HYPE/USDT on the 15-minute chart over approximately 13–14 months (April/May 2025 to June 2026, $10,000 capital each):
| Coin | Return | Max Drawdown | Win Rate | Profit Factor |
|---|---|---|---|---|
| SOL/USDT | +38.41% | 4.26% | 70.68% | 2.51 |
| BNB/USDT | +43.65% | 6.23% | 90.00% | 2.53 |
| HYPE/USDT | +104.48% | 9.16% | 85.49% | 1.74 |
Each coin was tuned slightly differently — a tighter Price Cap for BNB, a wider stop for HYPE, DCA enabled for SOL — but the core logic is identical across all three.
Common Mistakes to Avoid
Setting the Price Cap too low. A threshold below 0.5% on a 15-minute chart will trigger dozens of trades per day, most of them on noise rather than real moves. Start conservatively and tighten from there.
Skipping the filter. The STD+Percentile filter is what separates this strategy from a simple "buy every dip" approach. Without it, the bot will trade indiscriminately in choppy, directionless markets where mean reversion simply does not work.
Using DCA on unfamiliar assets. DCA improves your average entry but also increases your total exposure. On a coin you have not backtested, a move that keeps going against you will compound losses, not just the initial entry.
Not checking the SL warning. The red warning table on the chart is there for a reason. If it appears, the strategy has stopped trading silently. Always verify it is not showing before going live.
Mean reversion is one of the most consistent edges in crypto markets. With the Wunder DCA Strategy configured correctly, you can capture it automatically — on multiple coins, in both directions, around the clock.
The setup described here is not theoretical. It is the exact configuration used to generate the results in the table above. Start with the defaults, run your own backtest, and adjust from there.
Past performance does not guarantee future results. Always backtest before trading with real capital.